Understanding a confusion matrix
Updated on 22.09.25
3 minutes to read
Copy link
The confusion matrix in SEON
SEON’s confusion matrix expands on the traditional binary classification by showcasing the Review state as well. Instead of mapping outcomes to just “fraud” or “legitimate,” this approach reflects real-world fraud decisioning more accurately. Each transaction is categorized based on how it was initially scored by SEON and what the final manual decision was.
This results in a matrix where you can see, for example, how often SEON-approved transactions were later reviewed or declined by human analysts, or vice versa. This added granularity helps teams fine-tune rulesets and machine learning models by identifying discrepancies between automated decisions and manual outcomes.
The matrix outlines four key outcomes:
| Predicted fraud | Predicted legitimate |
Actual fraud | True positive (TP) | False negative (FN) |
Actual legitimate | False positive (FP) | True negative (TN) |
Definitions
- True positive (TP): A fraudulent transaction correctly flagged as fraud.
- False positive (FP): A legitimate transaction incorrectly flagged as fraud.
- True negative (TN): A legitimate transaction correctly identified as legitimate.
- False negative (FN): A fraudulent transaction that was missed by the system.
These categories form the foundation for assessing the accuracy of your fraud detection logic.

Precision
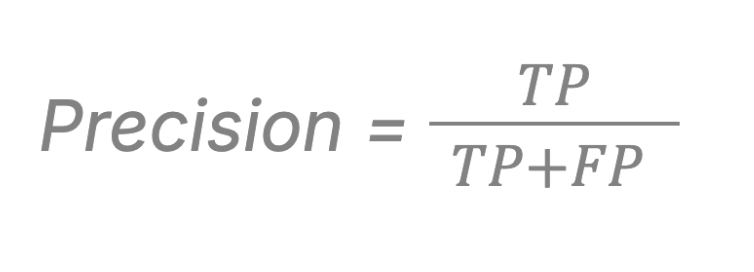
Precision measures the accuracy of fraud predictions. It describes the proportion of transactions flagged as fraud that were actually fraudulent.

A high precision score means your system generates fewer false positives and is more reliable when it flags a transaction as fraud.
Example: If 100 transactions were flagged as fraud and 80 of them were truly fraudulent, precision is 80%.
Recall
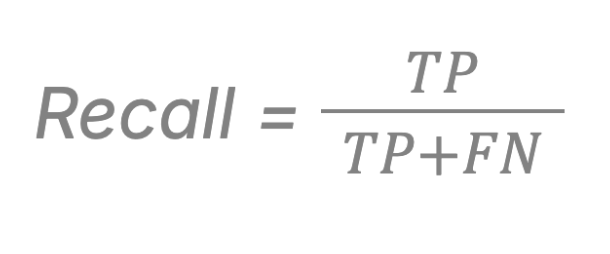
Recall indicates the ruleset’s or model’s ability to detect fraud. It shows what proportion of actual fraud cases were successfully identified.

A high recall score means fewer fraudulent transactions slip through undetected.
Example: If there were 200 total fraud cases and your system caught 160 of them, recall is 80%.
Summary
- Use precision to measure how trustworthy your fraud flags are.
- Use recall to assess how much fraud is being caught overall.
- Both metrics are critical to fine-tuning your detection strategy depending on whether you want to reduce false positives, catch more fraud, or strike a balance between the two.
Monitoring these values through SEON's reporting tools helps you continuously improve your fraud prevention outcomes.
Learn more
Dive into the details of where you'll encounter confusion matrices in SEON.
- Custom rules and parameters: Learn how to create custom rules and fight fraud your way.
- AI rule suggestions: Understand how SEON’s explainable AI rules work behind the scenes.