


Customers

Updated on 02.11.26

5 minutes to read

Copy link
Overview
The Customers page displays the same data as the Transactions page, but broken down per customer rather than by individual transactions.
You can access the same search and filtering functionalities as the Transactions list.
- The Transactions list can be filtered by selecting the “Filters” drop down at the top of the screen. Complex filters can be easily applied to any data fields in your account by using the simple interface. Please see instructions under the Transactions list for further information.

You can also customize your Customer list view by clicking the cogwheel icon in the top right corner. Here, you can rearrange the existing data fields by dragging and moving them or add new ones at the bottom.

Exports
You can export either the default or filtered customer list as a CSV for external analysis.
To export the current customer list, click the Export all button at the bottom right corner of the screen, enter your email address, choose the format you want to export the data to and select the Export button. If a filter is currently applied to the main customer list, then you're also able to select whether the export contains all transactions or the currently filtered view.

When the export has been generated, you should receive a download link via email.
Previous exports can be re-downloaded or deleted from the list on the right side.

Clone search
You can select multiple customers and run a clone search to identify duplicate, synthetic or highly similar customer data values to uncover suspicious patterns or fraudulent activities. This allows you to link related customer profiles, even when fraudsters attempt to obscure their actions by altering small details.

Customer details view
Clicking on any customer row in the customer list will bring up the customer details view for that customer.
This screen has three main tabs for investigating and analyzing the selected customer: Details, Activity and Network graph.
Details
You can see the same widgets as in the Transaction Details Widgets in the Details page. They show the latest data aggregated across all transactions for the selected customer. Please see details on these under Transaction Details for further information.

Additionally, when viewing a customer, you can export all of their data in a PDF format by clicking the button at the bottom of the page. This is useful for writing chargeback disputes/re-presentment documents.

New Details

The customer details page aggregates data from all of a customer's transactions into one view. You decide which widgets appear and in which order, and an artificial intelligence (AI) summary describes the customer's behavior in plain language.
The page has two columns:
- The Insights column holds analysis widgets, such as Overview, Behavior, Rule statistics and Locations.
- The Actions column holds widgets you act from, such as List status, Exclusion, Associated alerts and cases, and Notes.
Widgets that need a permission you don't have, such as Rule statistics or Associated alerts and cases, are hidden.
Customize the page layout
You decide which widgets appear on the page and in which order. Your layout is saved to your user and applies every time you open a customer.
To customize the page:
- Select the settings icon at the top of the page.
- In Customize details, turn widgets on or off and drag them to reorder them within their column.
- Select Save.
At least one widget must stay turned on.
The Customize details window lists the widgets of each column:
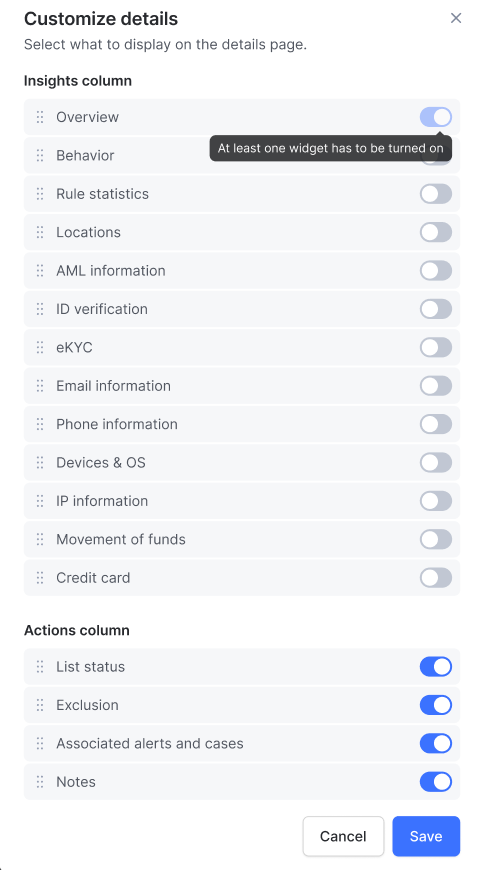
Insights widgets
Overview widget
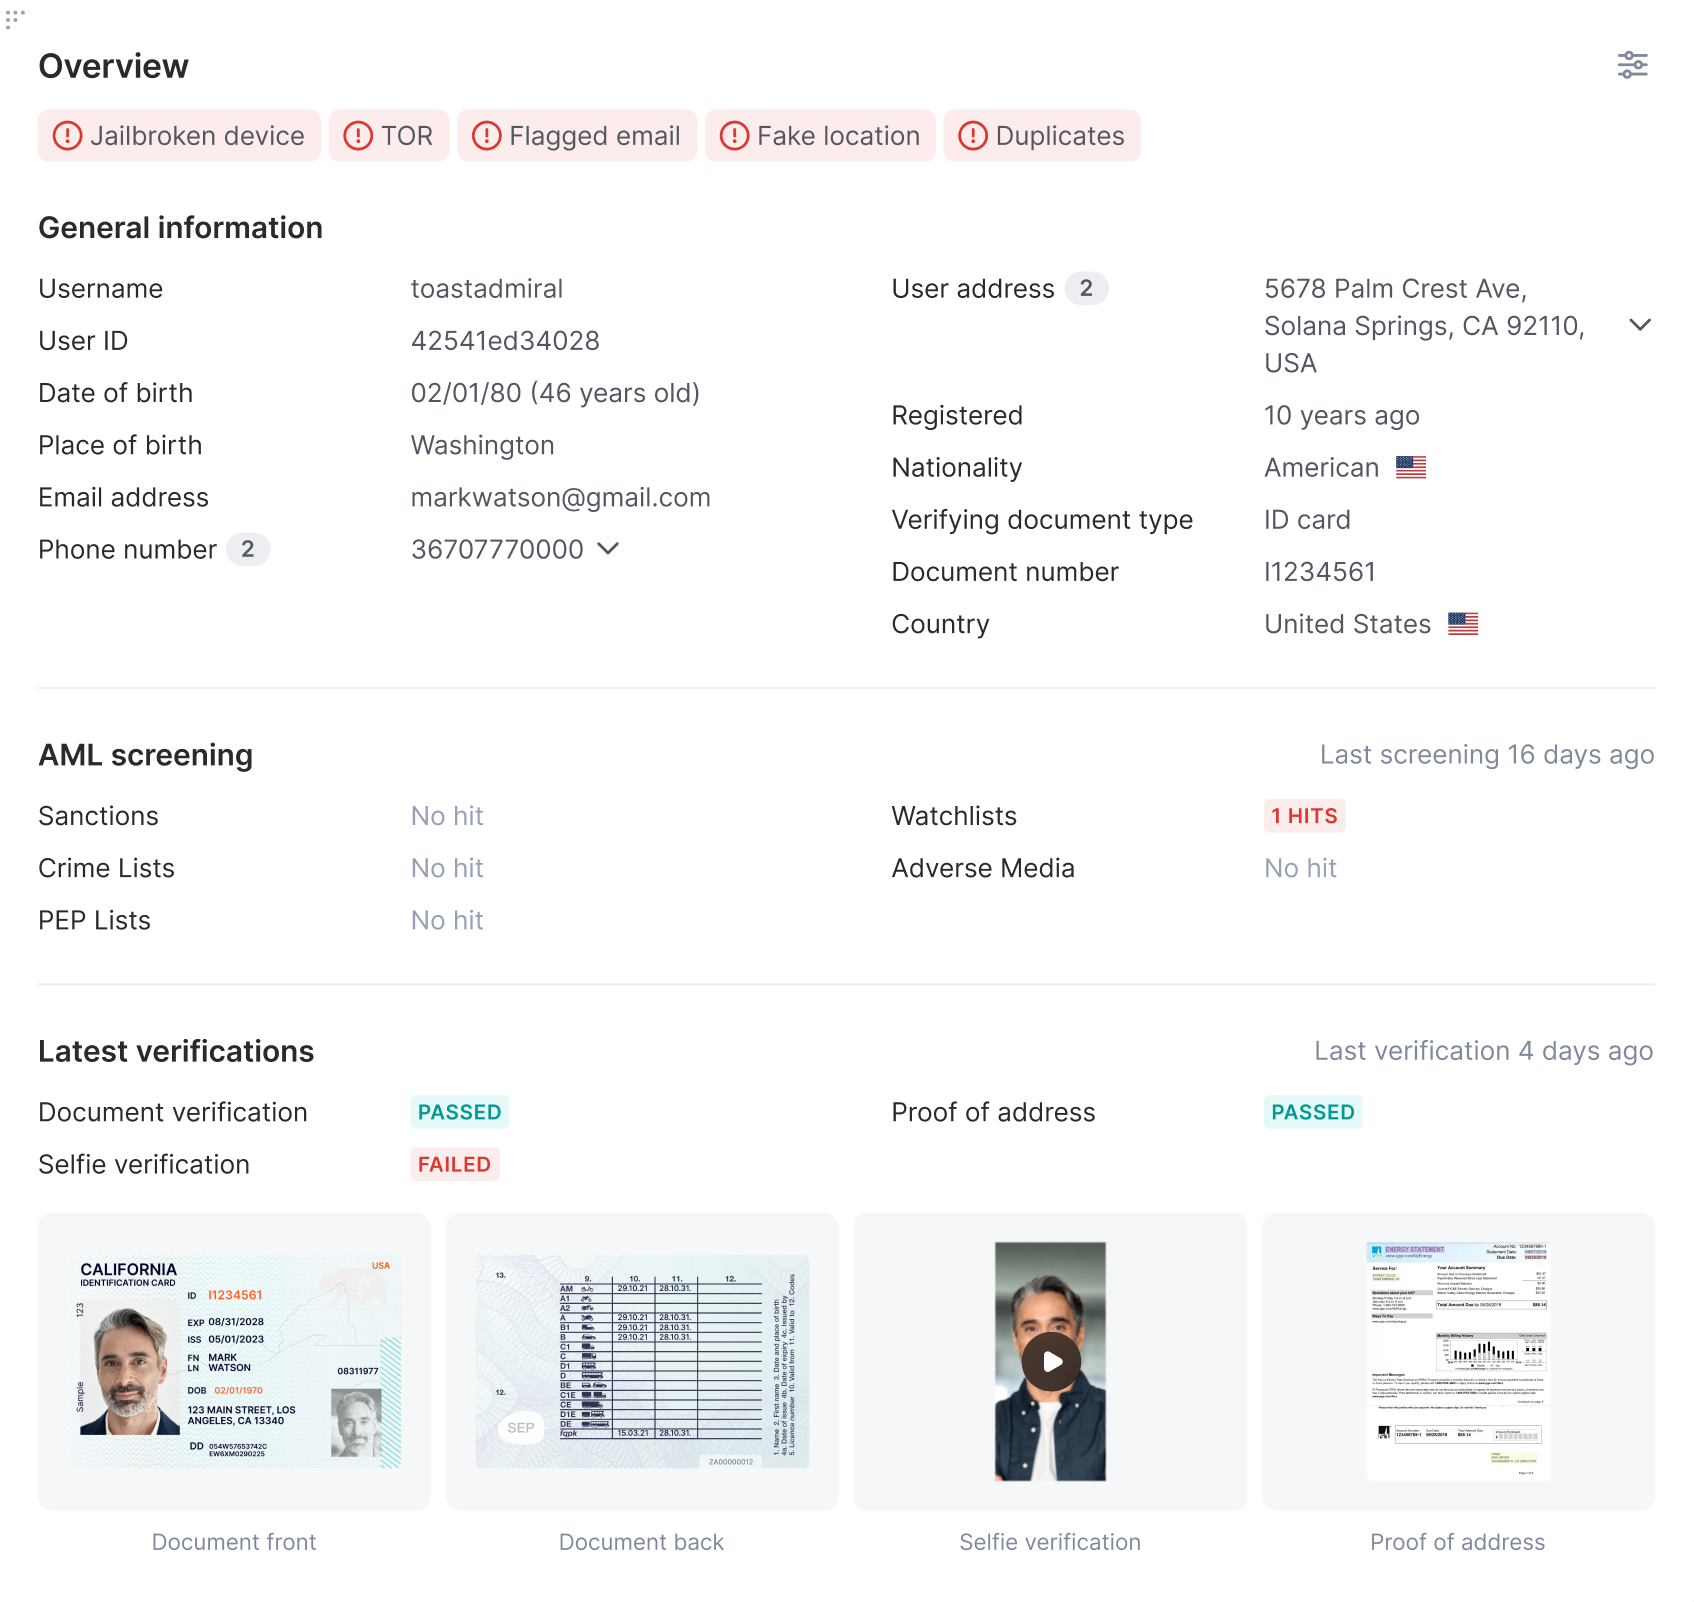
The Overview widget summarizes the customer at a glance. It has four sections:
- Risk flags tags each risk signal found on any of the customer's transactions, such as Jailbroken device, TOR, Flagged email or Fake location. If no flag is active, the section is hidden.
- General information shows key fields, such as username, user ID, date of birth, email, phone number, address and nationality. A field with several values shows a count. Select it to see all values.
- AML screening shows the latest Anti-Money Laundering (AML) result for Sanctions, Crime lists, Politically Exposed Persons (PEP) lists, Watchlists and Adverse media, each with No hit or the number of hits. The header shows when the last screening ran.
- Latest verifications shows the status of document verification, selfie verification and proof of address, with up to 4 document thumbnails. Failed checks still show their document.
To customize the widget, select its settings icon. In Customize overview, turn sections on or off, and add, remove and reorder fields with Add new data fields, then select Save.
At least one section must stay turned on.
The Overview widget with all four sections turned on:
Behavior widget
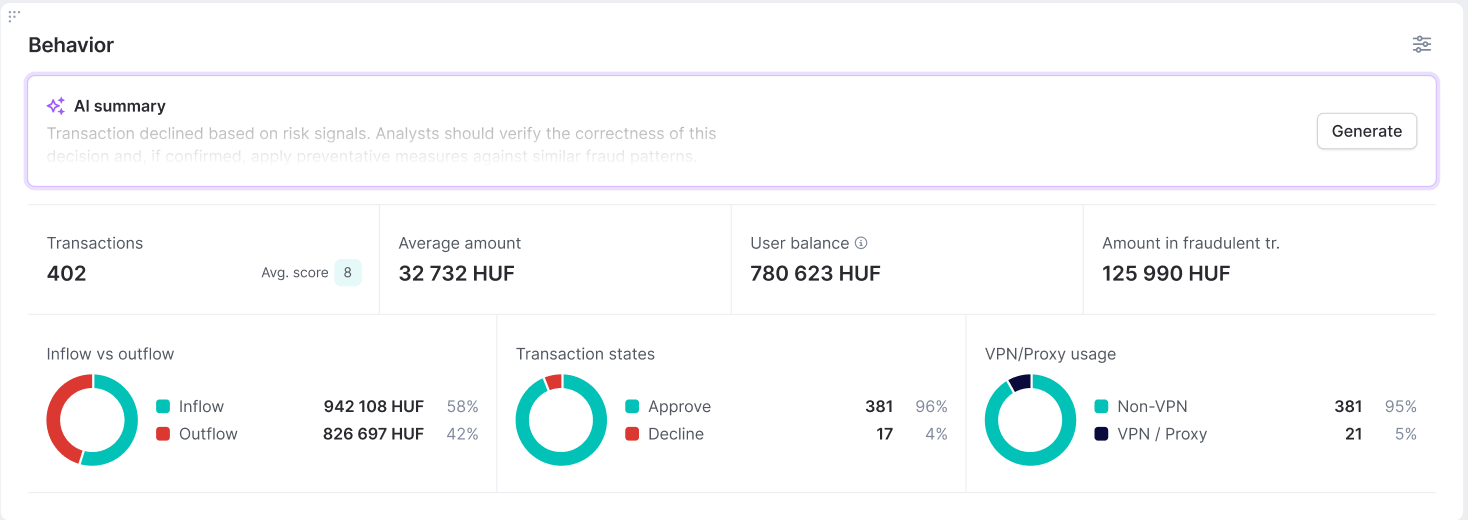
The Behavior widget summarizes how the customer transacts across their full history. It has three parts:
- AI summary describes the customer's overall behavior, not a single transaction. Select Generate to create it, and rate it with the thumbs up and thumbs down icons.
- Metrics show up to 4 headline figures, chosen from Transactions with the average fraud score, Average amount, User balance, Amount in fraudulent transactions and Reports filed.
- Statistics charts break transactions down by Inflow vs outflow, Transaction states, VPN/Proxy usage, AML screening results and Transaction outcomes.
User balance is the balance your platform reports. SEON does not calculate it.
To set which metrics and charts appear, and in which order, select the widget's settings icon.
The Behavior widget with a generated AI summary:
Rule statistics widget
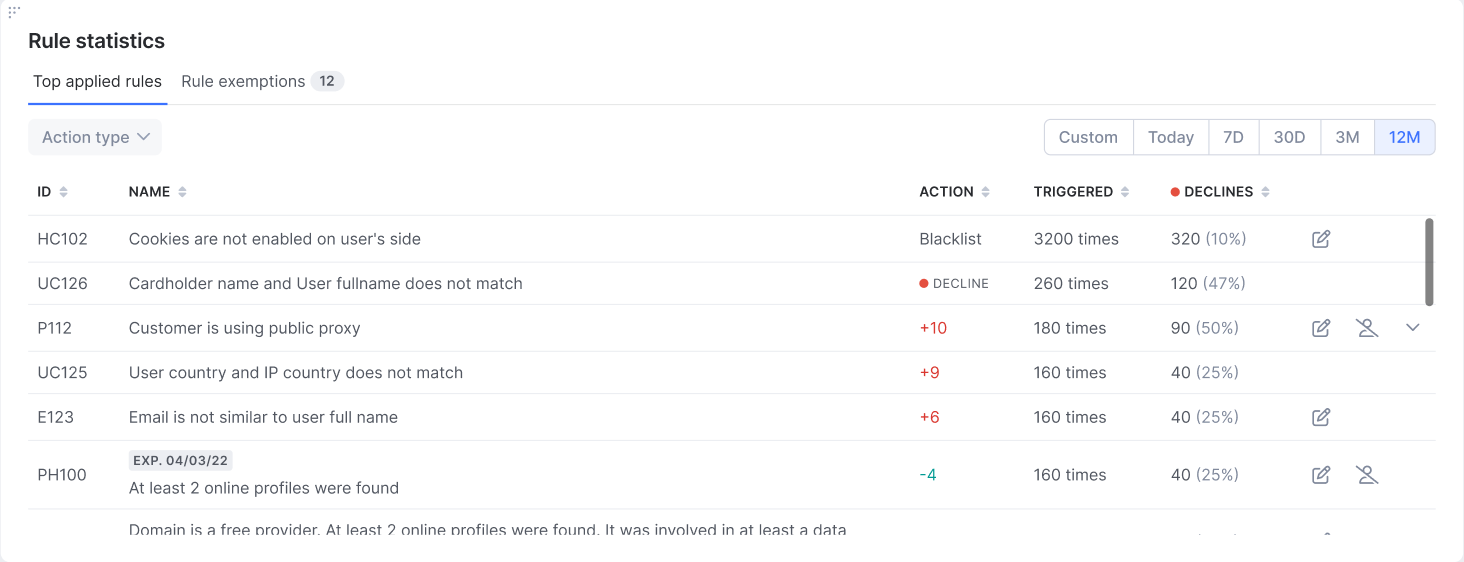
The Rule statistics widget shows which rules fired for this customer. Trigger counts apply to this customer only, not to your whole account. It has two tabs:
- Top applied rules lists each rule with its ID, name, action, trigger count and declines. From a row, you can edit the rule or exclude the customer from it. Rules with an expiry date show an EXP. badge.
- Rule exemptions lists the rules this customer is excluded from, with a count on the tab.
Filter by Action type, and set the date range to Today, 7D, 30D, 3M, 12M or Custom.
The Rule statistics widget on the Top applied rules tab:
Locations widget
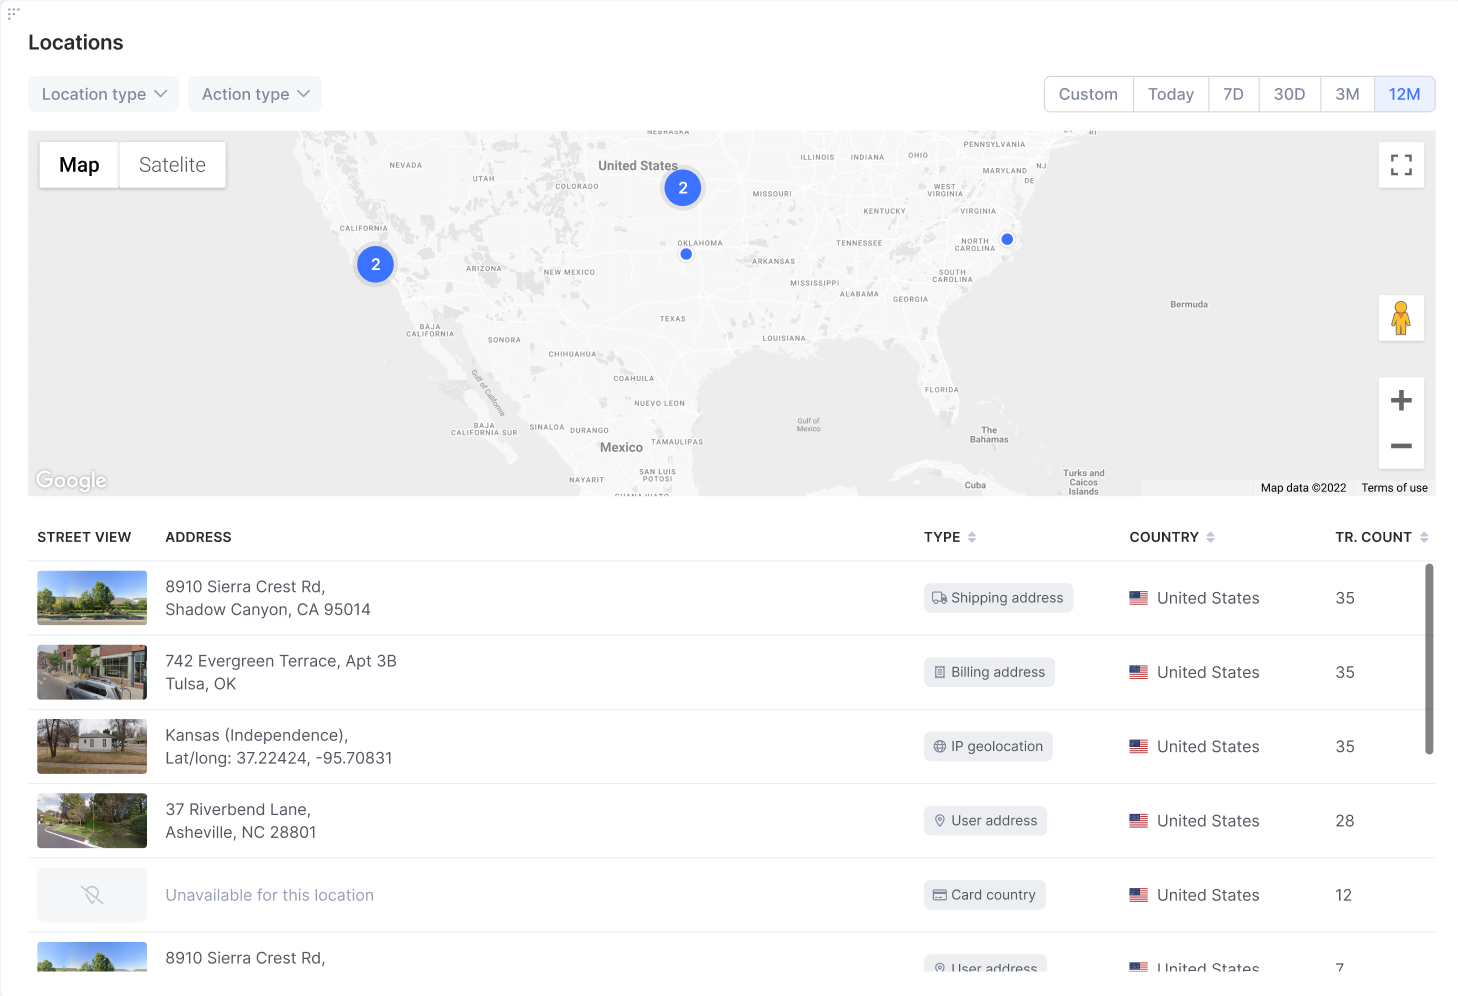
The Locations widget plots the customer's addresses and locations on a map. It has a Locations tab and a Geolocations tab.
On the Locations tab, filter by Location type and Action type, and set the date range. Nearby pins group into a cluster with a count. Select a cluster to zoom in.
Select Map or Satellite to change the view, or open the map in full screen.
The table below the map lists each location with a street view image, address, type, country and transaction count. Location types include user address, billing address, shipping address, IP geolocation and card country. IP geolocation and card country rows have no street view image.
The Locations widget with map pins and the location table:
Actions widgets
The Actions column widgets work the same way as on the transaction details page. For each widget, see Transaction details widgets.
Export customer data as PDF
You can export all of a customer's data as a PDF, for example to support a chargeback dispute or re-presentment.
Activity

When viewing the details of a customer, all their historical transactions can be viewed on the Activity tab accessible at the top of the screen.
This view shows the detail of each transaction, along with the ability to update the state of each transaction directly.
You can select the type of transaction from the dropdown above the column headers and additionally. You can filter the transactions based on the action type or change the date range to either show all transactions or those within a specific time period. The screen can be customized to show specific columns of data by clicking the cogwheel icon in the top right corner.

Network analysis

Fraud doesn’t happen in isolation. Accounts are often linked through shared devices, IPs or payment methods, sometimes by organized fraud rings, sometimes by legitimate users.
Network analysis helps you uncover hidden links between customer profiles and visualize coordinated activity.
SEON offers three ways to explore these connections:
- Graph: Visualize shared data points and connected customers through an interactive graph.
- Similarity ranking: Stack-rank customers automatically by identifying who is identical, highly similar or associated.
- Data explorer: Explore shared connections by specific data points or identifiers.
Customer compare
You can compare connected customers’ last transactions side by side by clicking the Compare button next to the connected customer’s information.

You'll be able to review all the transaction data in a popup window. Here, you can also select a different connected customer to compare in the top right dropdown.
