

Network analysis
Updated on 20.02.26
3 minutes to read
Copy link
Overview
Fraud doesn’t happen in isolation. Accounts are often linked through shared devices, IPs or payment methods — sometimes by organized fraud rings, sometimes by genuine customers.
Network analysis uncovers hidden links between customer profiles, helping you spot coordinated activity, shut down fraud rings early and reduce false positives from legitimate shared behaviors.
SEON offers four ways to investigate these networks:
- Graph: View the selected customer and uncover connections they share with others through a wide variety of data points, helping you identify hidden relationships and detect potential fraud networks.
- Data explorer: Pick a customer and see who else shares the same data points, like devices or emails. Useful when you want to manually check connections.
- Similarity ranking: SEON does the heavy lifting and shows you the customers most closely linked to the one you’re looking at. No manual searching needed.
- Clone search: Run a search across your whole database to find groups of accounts that look alike or share key information. Great for spotting fraud rings at scale.
The network analysis tab
The Network analysis tab is available on every customer, transaction or alert page. It contains three tools designed to explore and rank connections including Graph, Similarity ranking and Data explorer.
Graph
In the Graph tab, you can easily uncover relationships between the customer you are investigating and others, as well as see which data points they share.
Each node is color-coded to help you quickly interpret the type of relationship:
- Blue: Connected customers
- Gray: Connected data fields
- Red: Values that appear on a blacklist
- Green: Values that appear on a whitelist
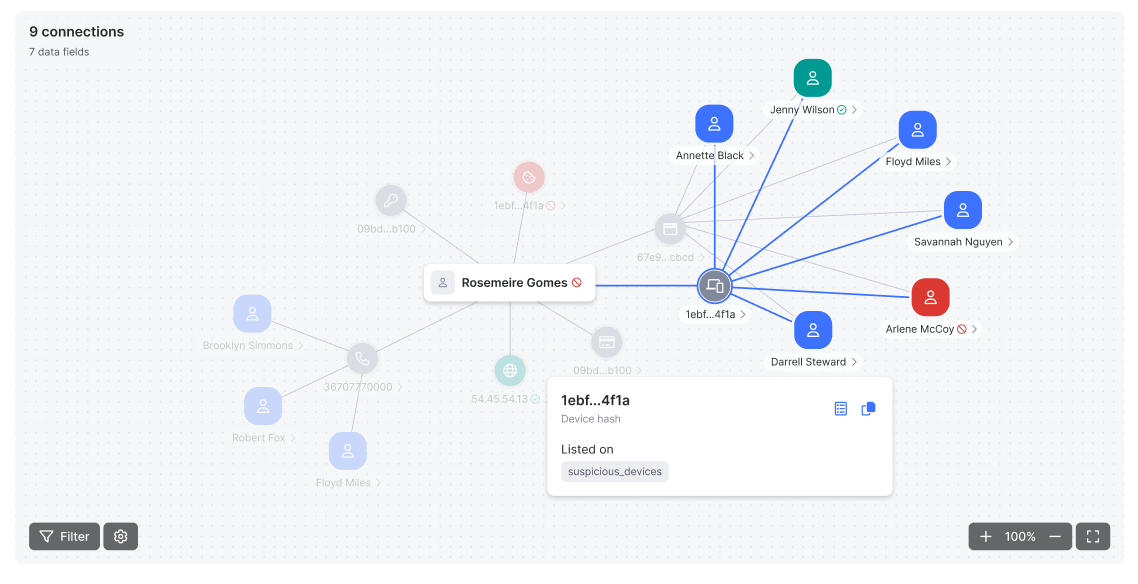
When you select multiple data points, the graph will display all matching connections linked to the customer. From there, you can access detailed customer information, including profile details and listing data, and take further action by comparing linked users, adding users to a list or setting up a post-decision automation.
Additionally, all data shown in the graph is available in a table view below, where you can also initiate bulk actions to facilitate efficient investigations.
Similarity ranking
Similarity ranking automatically surfaces the customer profiles most closely related to the one you’re investigating, using SEON’s graph-based closeness metric. Instead of manually checking data points, it highlights the strongest connections first, showing key identifiers (such as emails or usernames), the number of shared values and a closeness label — identical, highly similar or associated.
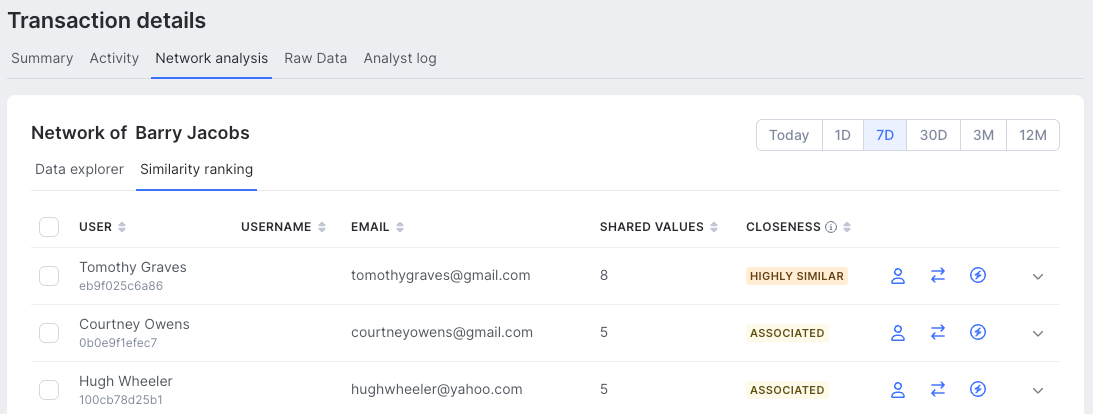
You can expand any profile to review shared values in detail, compare them side by side and take action by assigning tags, updating statuses or adding profiles to lists.
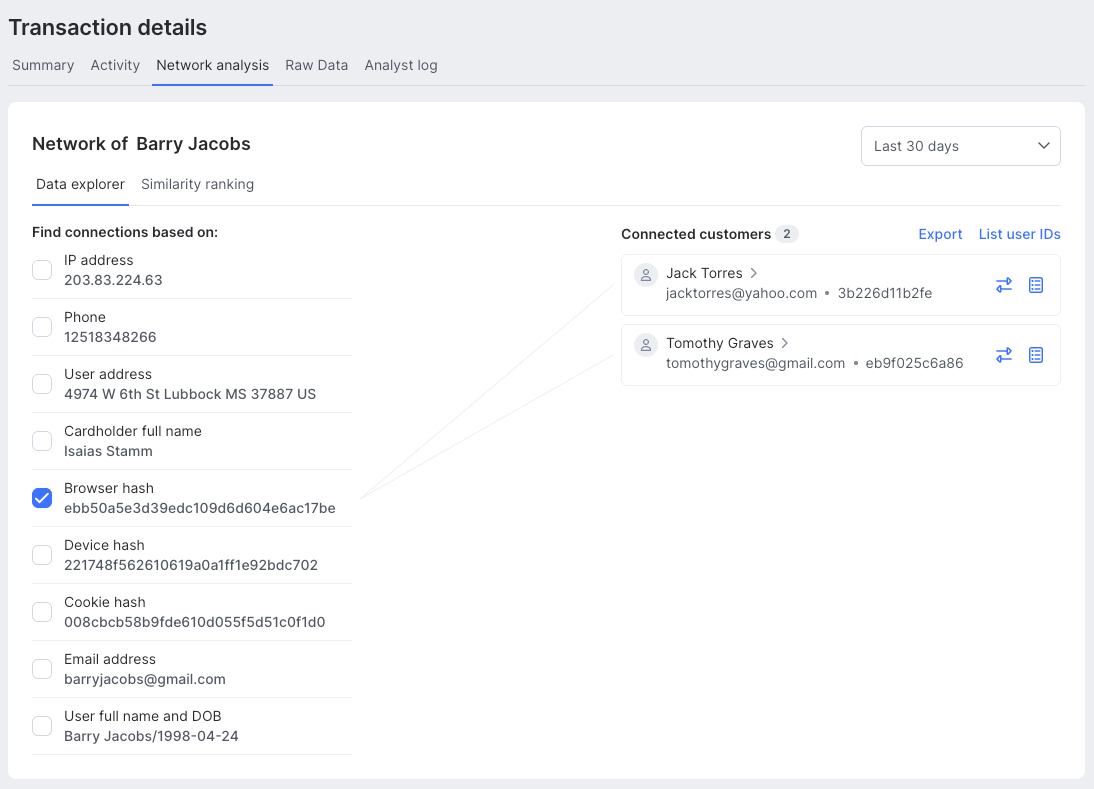
Data explorer
With the data explorer, you can visualize and explore the relationships between the current customer and others in your database. Simply select values such as a device hash, email or IP address to see which other customers share them. If you select multiple data points, only profiles that match all chosen values will appear, giving you stricter and more accurate results.
Clone search
Clone search helps you identify clusters of linked accounts across your customer base, rather than starting from a single profile. You can search for shared data points such as browser hash, device hash, cookie hash, phone number, IP address, password hash or card hash. Searches can be run directly from the Customers page by selecting profiles and choosing data points, or from the Manual Lookup page by uploading a CSV or XLSX file.
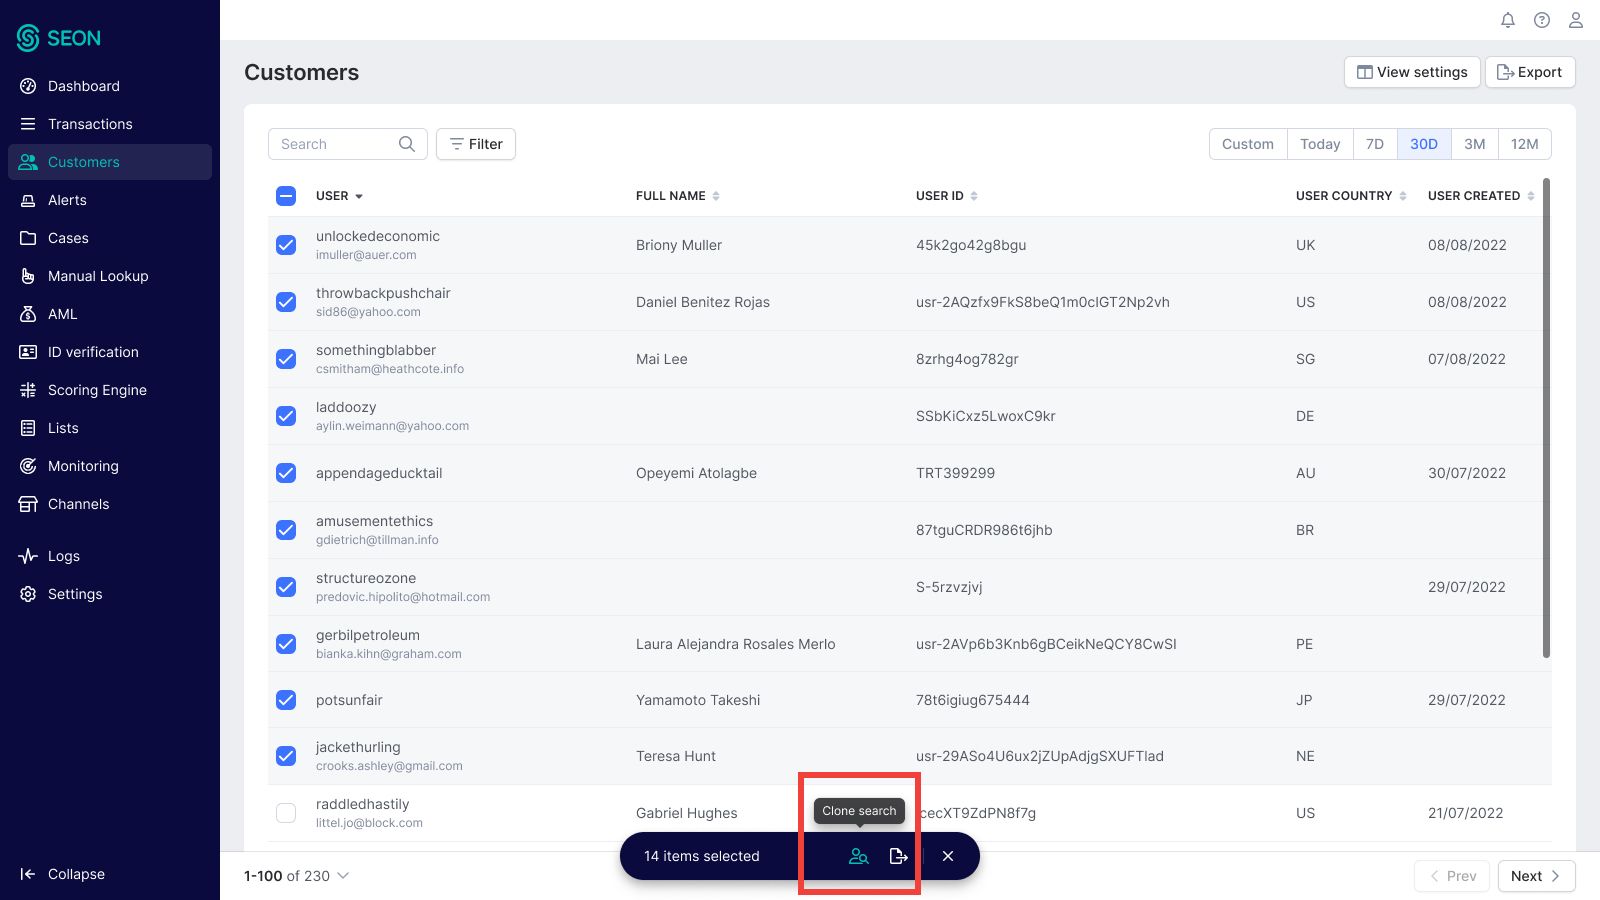
Results are grouped into customer clusters, making it easier to spot potentially fraudulent networks. From there, you can export the results for further analysis or bulk-manage them by adding clusters to blacklists, whitelists or custom lists. Clone search is especially useful for uncovering synthetic identities or exposing large fraud rings that would be hard to detect through single-account reviews.