

AI chart builder (Beta)
Updated on 04.05.26
5 minutes to read
Copy link
Overview
AI chart builder turns a question into immediate insights by creating a chart you can review, refine, save and pin to your SEON dashboard.
Instead of configuring a chart field by field, you can describe the question you want answered. SEON generates a preview along with a short rationale explaining which fields and logic AI used. You can adjust the visualization or date range before saving. Saved charts are shared with your team through the Chart catalog, so anyone with the right permission can add them to their own dashboard.
Before you start
- The feature must be enabled for your account. If you do not see the Create a chart with AI option, contact your SEON administrator
- You need Chart write permission to create, edit or delete AI-generated charts
- Users without chart write permission can still open the Chart catalog and add existing team-created charts to their dashboard
Dashboard limits to be aware of
You can create:
- Up to 50 charts total.
- Up to 100 saved AI-generated charts in your team's chart catalog.
What data can the AI chart builder analyze?
AI chart builder works with your transaction and customer records.
It does not currently support the following SEON datasets or modules:
- AML screening data
- Standalone IDV session or review data
- Rules or rule configuration data
- Lists data
- Cases or case management data
- Other module-specific datasets outside the underlying transaction and customer records
If your question relies on one of the datasets above, AI will generate the chart from the underlying transaction or customer data instead.
How to create a chart with AI
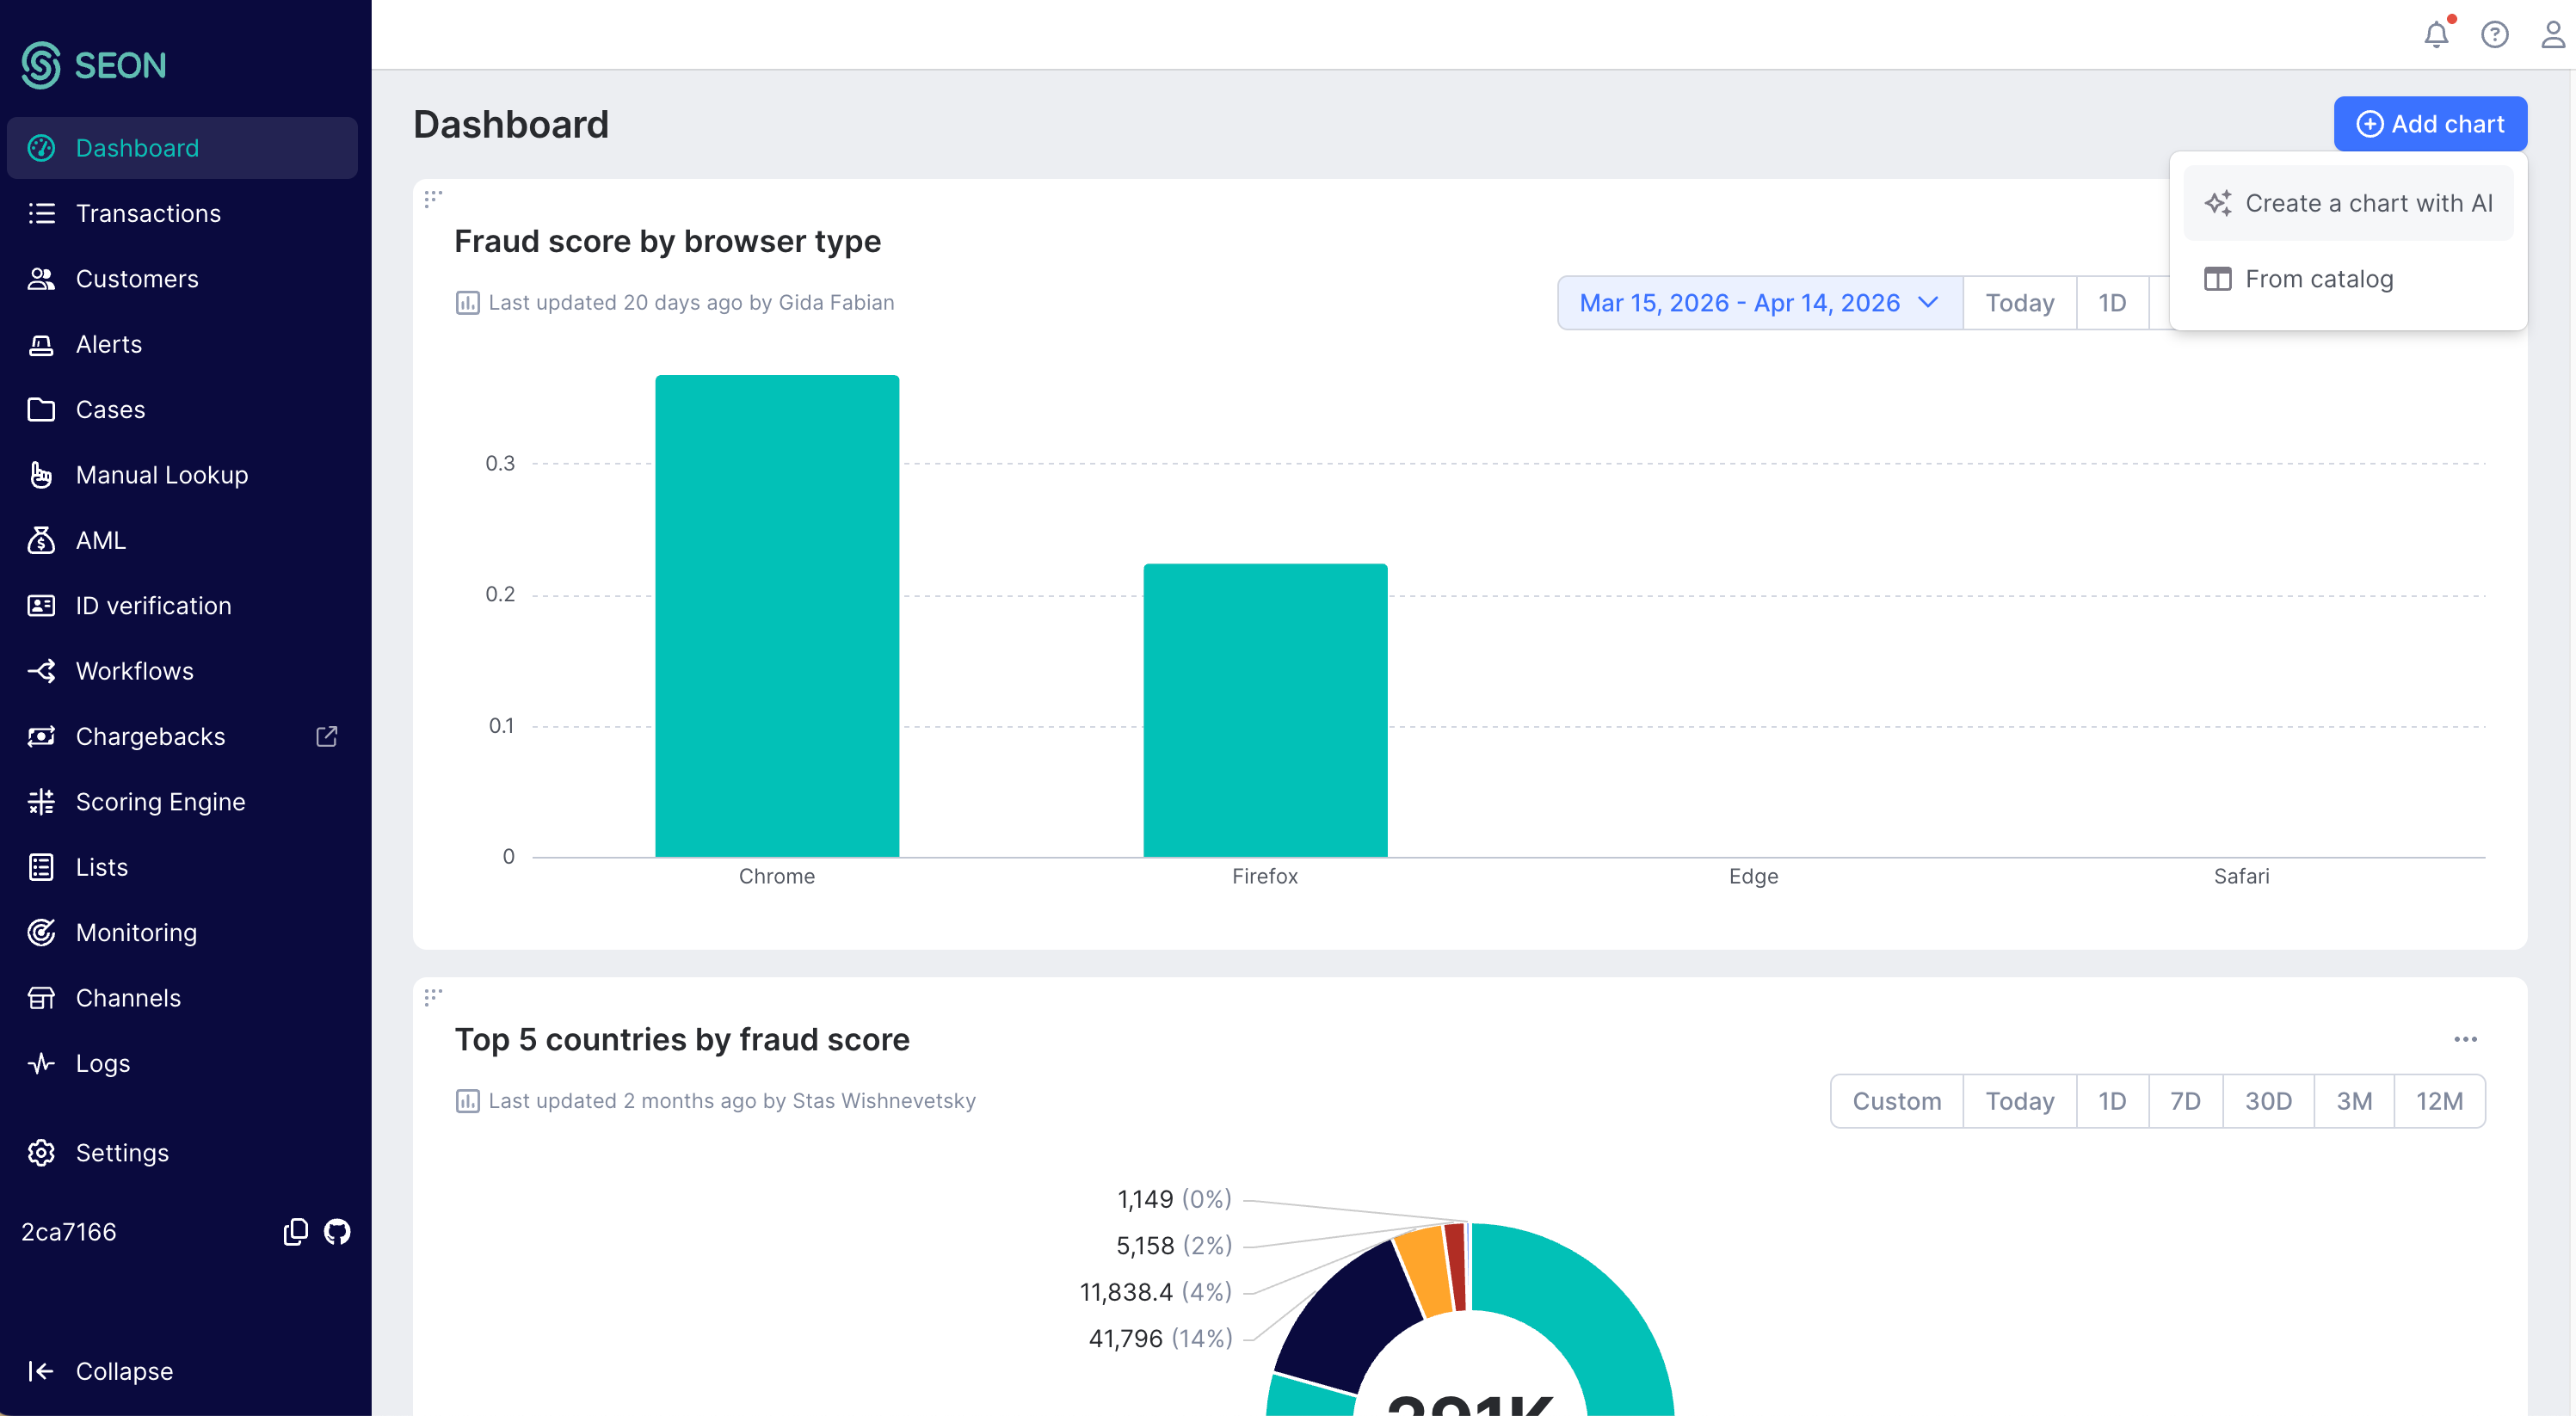
- Open Dashboard.
- Select Add chart in the top right corner.
- Choose Create a chart with AI.
- Enter a prompt describing what you want to see. You can also pick one of the suggested starter prompts to get going quickly.
- Review the generated preview and its rationale.
- Optionally refine the result by changing the visualization type or adjusting the date range.
- Enter a chart title.
- Select Save.
How to review the chart rationale
Each chart is accompanied by a short rationale explaining how the AI interpreted your prompt, including which fields, aggregations and filters it applied.
Use the rationale to:
- Confirm that the chart answers your actual question
- Check which underlying field is being used when several fields could match your prompt (for example, which country field was selected)
- Spot when the AI has misread part of the prompt, so you can refine or rewrite it
The rationale updates whenever the chart is regenerated or modified, and it is saved with the chart.
How to refine a generated chart
After the preview appears, you can adjust the chart without starting over.
Change the visualization type
When the generated result supports more than one format, you can switch between:
LineColumnBarDonutMetricTable
If a visualization type is not available for your result, it will not appear as an option.
Adjust the date range
Use the date filter to change the time period covered by the chart. You can apply a preset range or define a custom range.
Save a chart and share it with your team
Selecting Save adds the chart to your team’s shared Chart catalog.
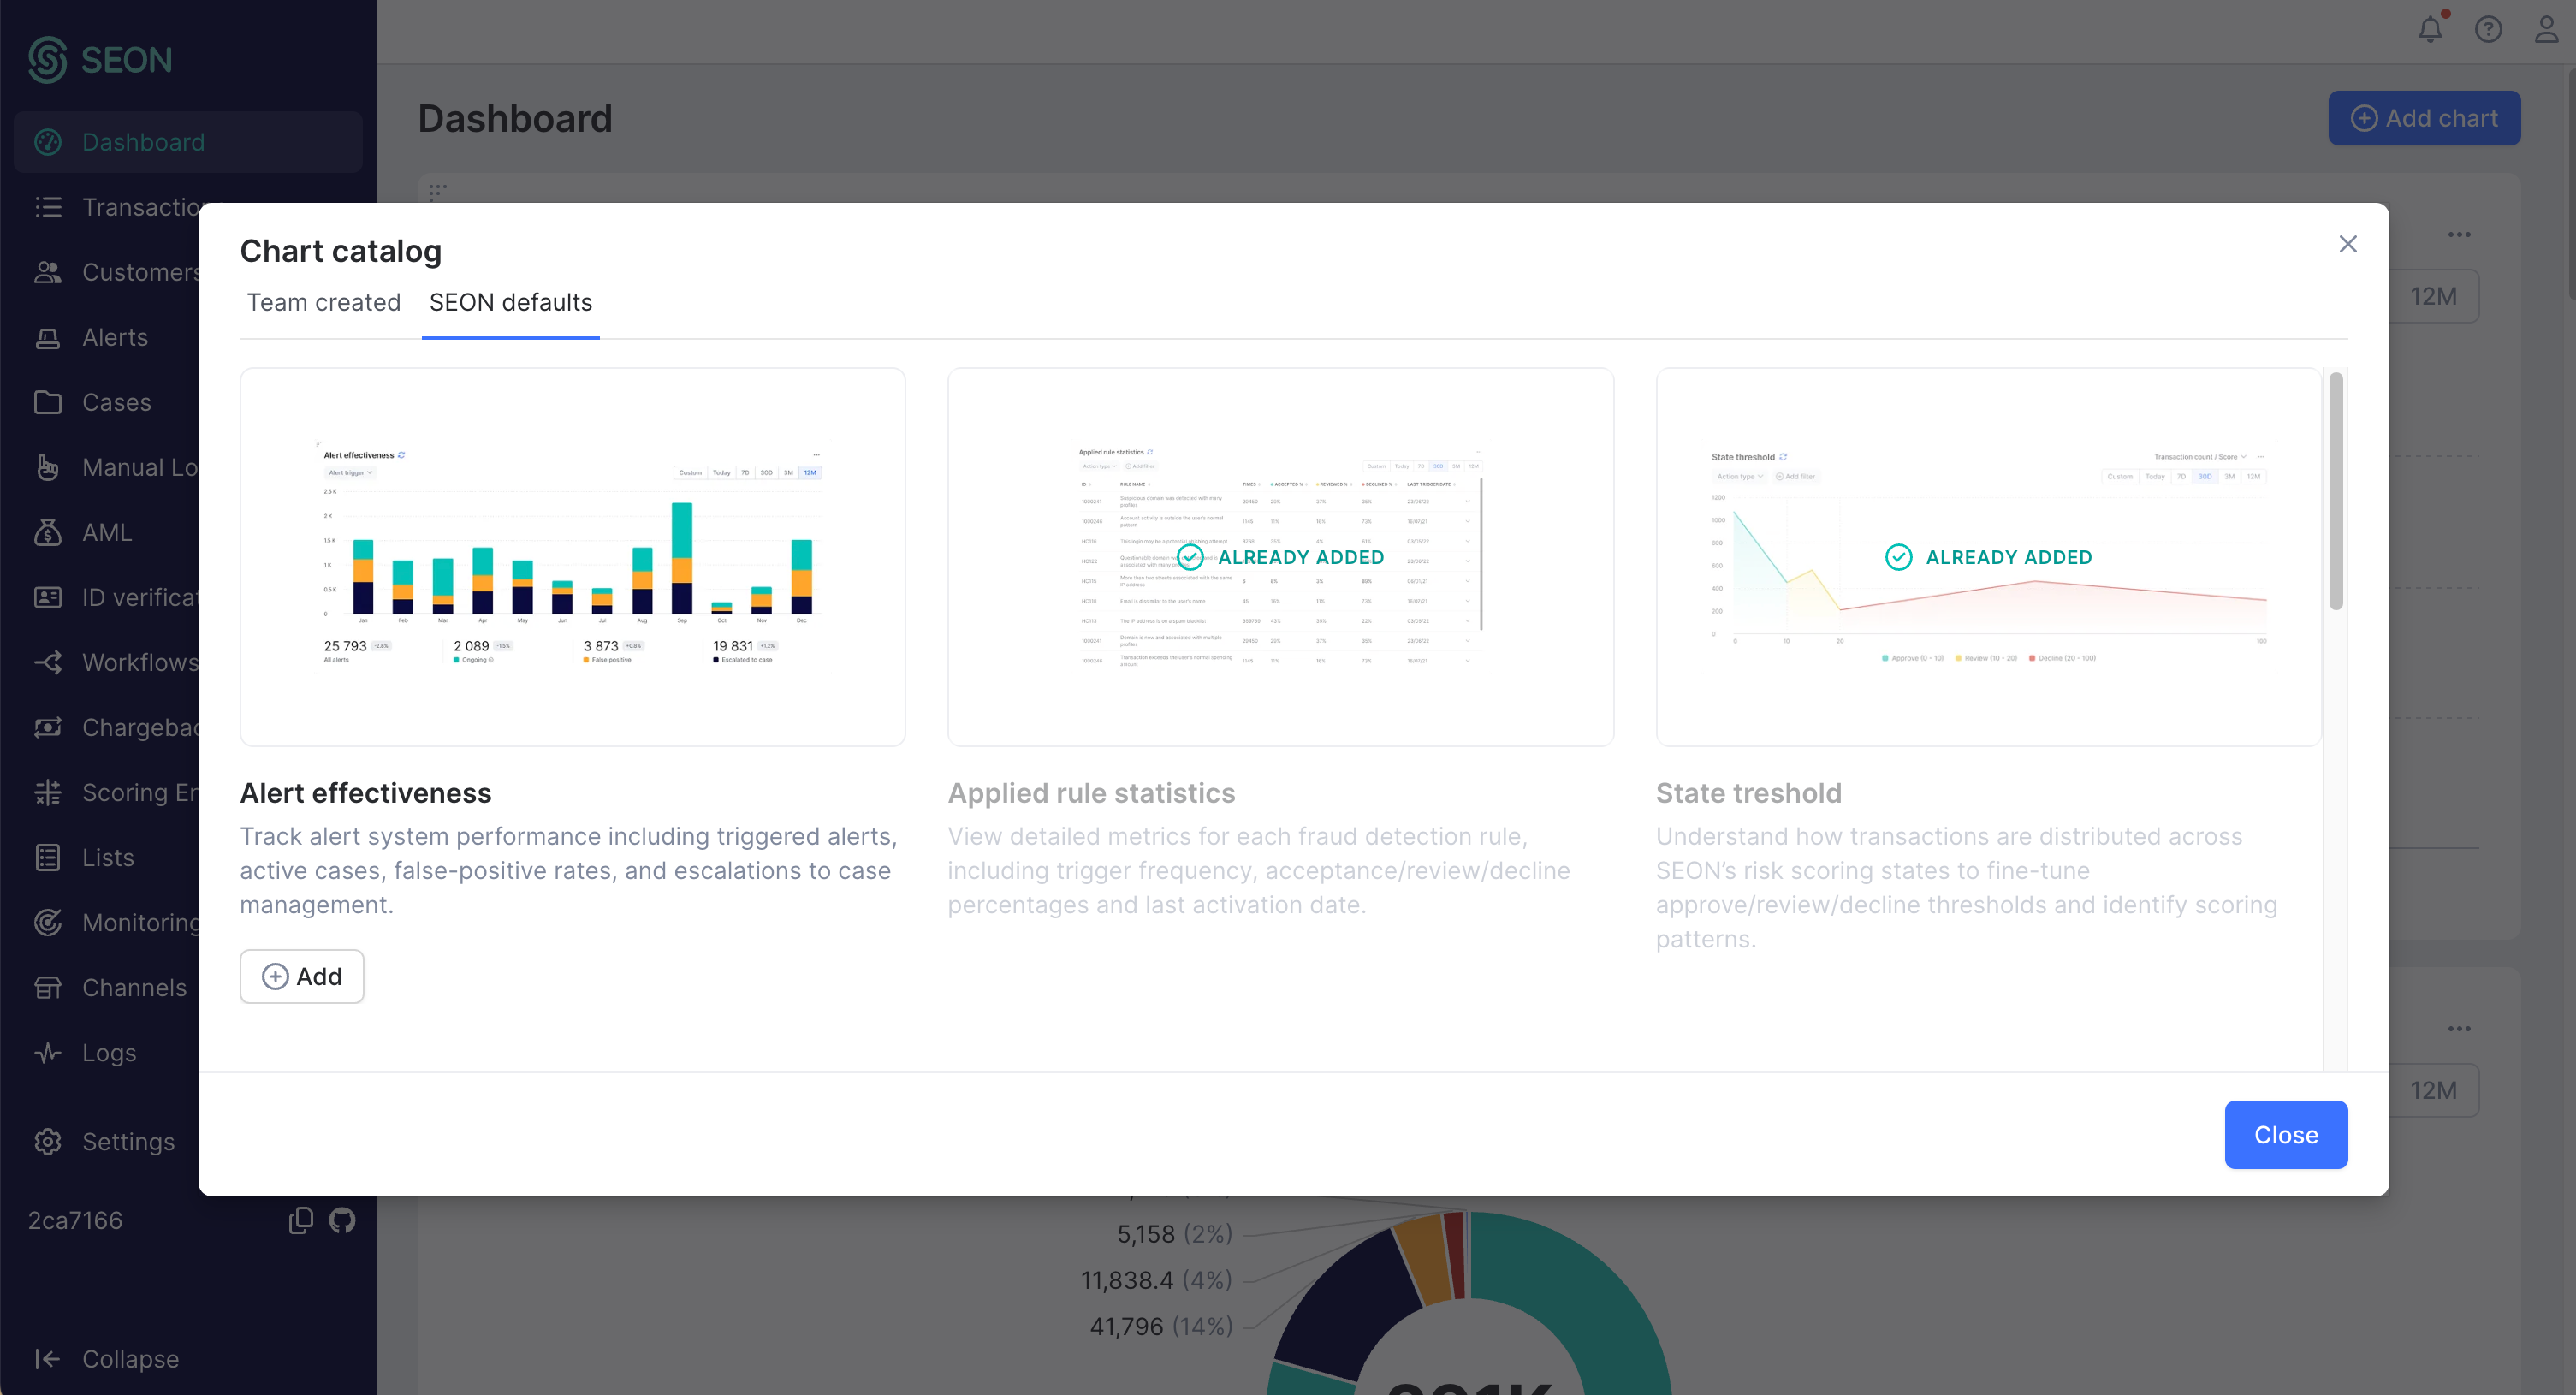
The Chart catalog has two tabs:
Team-created: AI-generated charts saved by you and your teammates
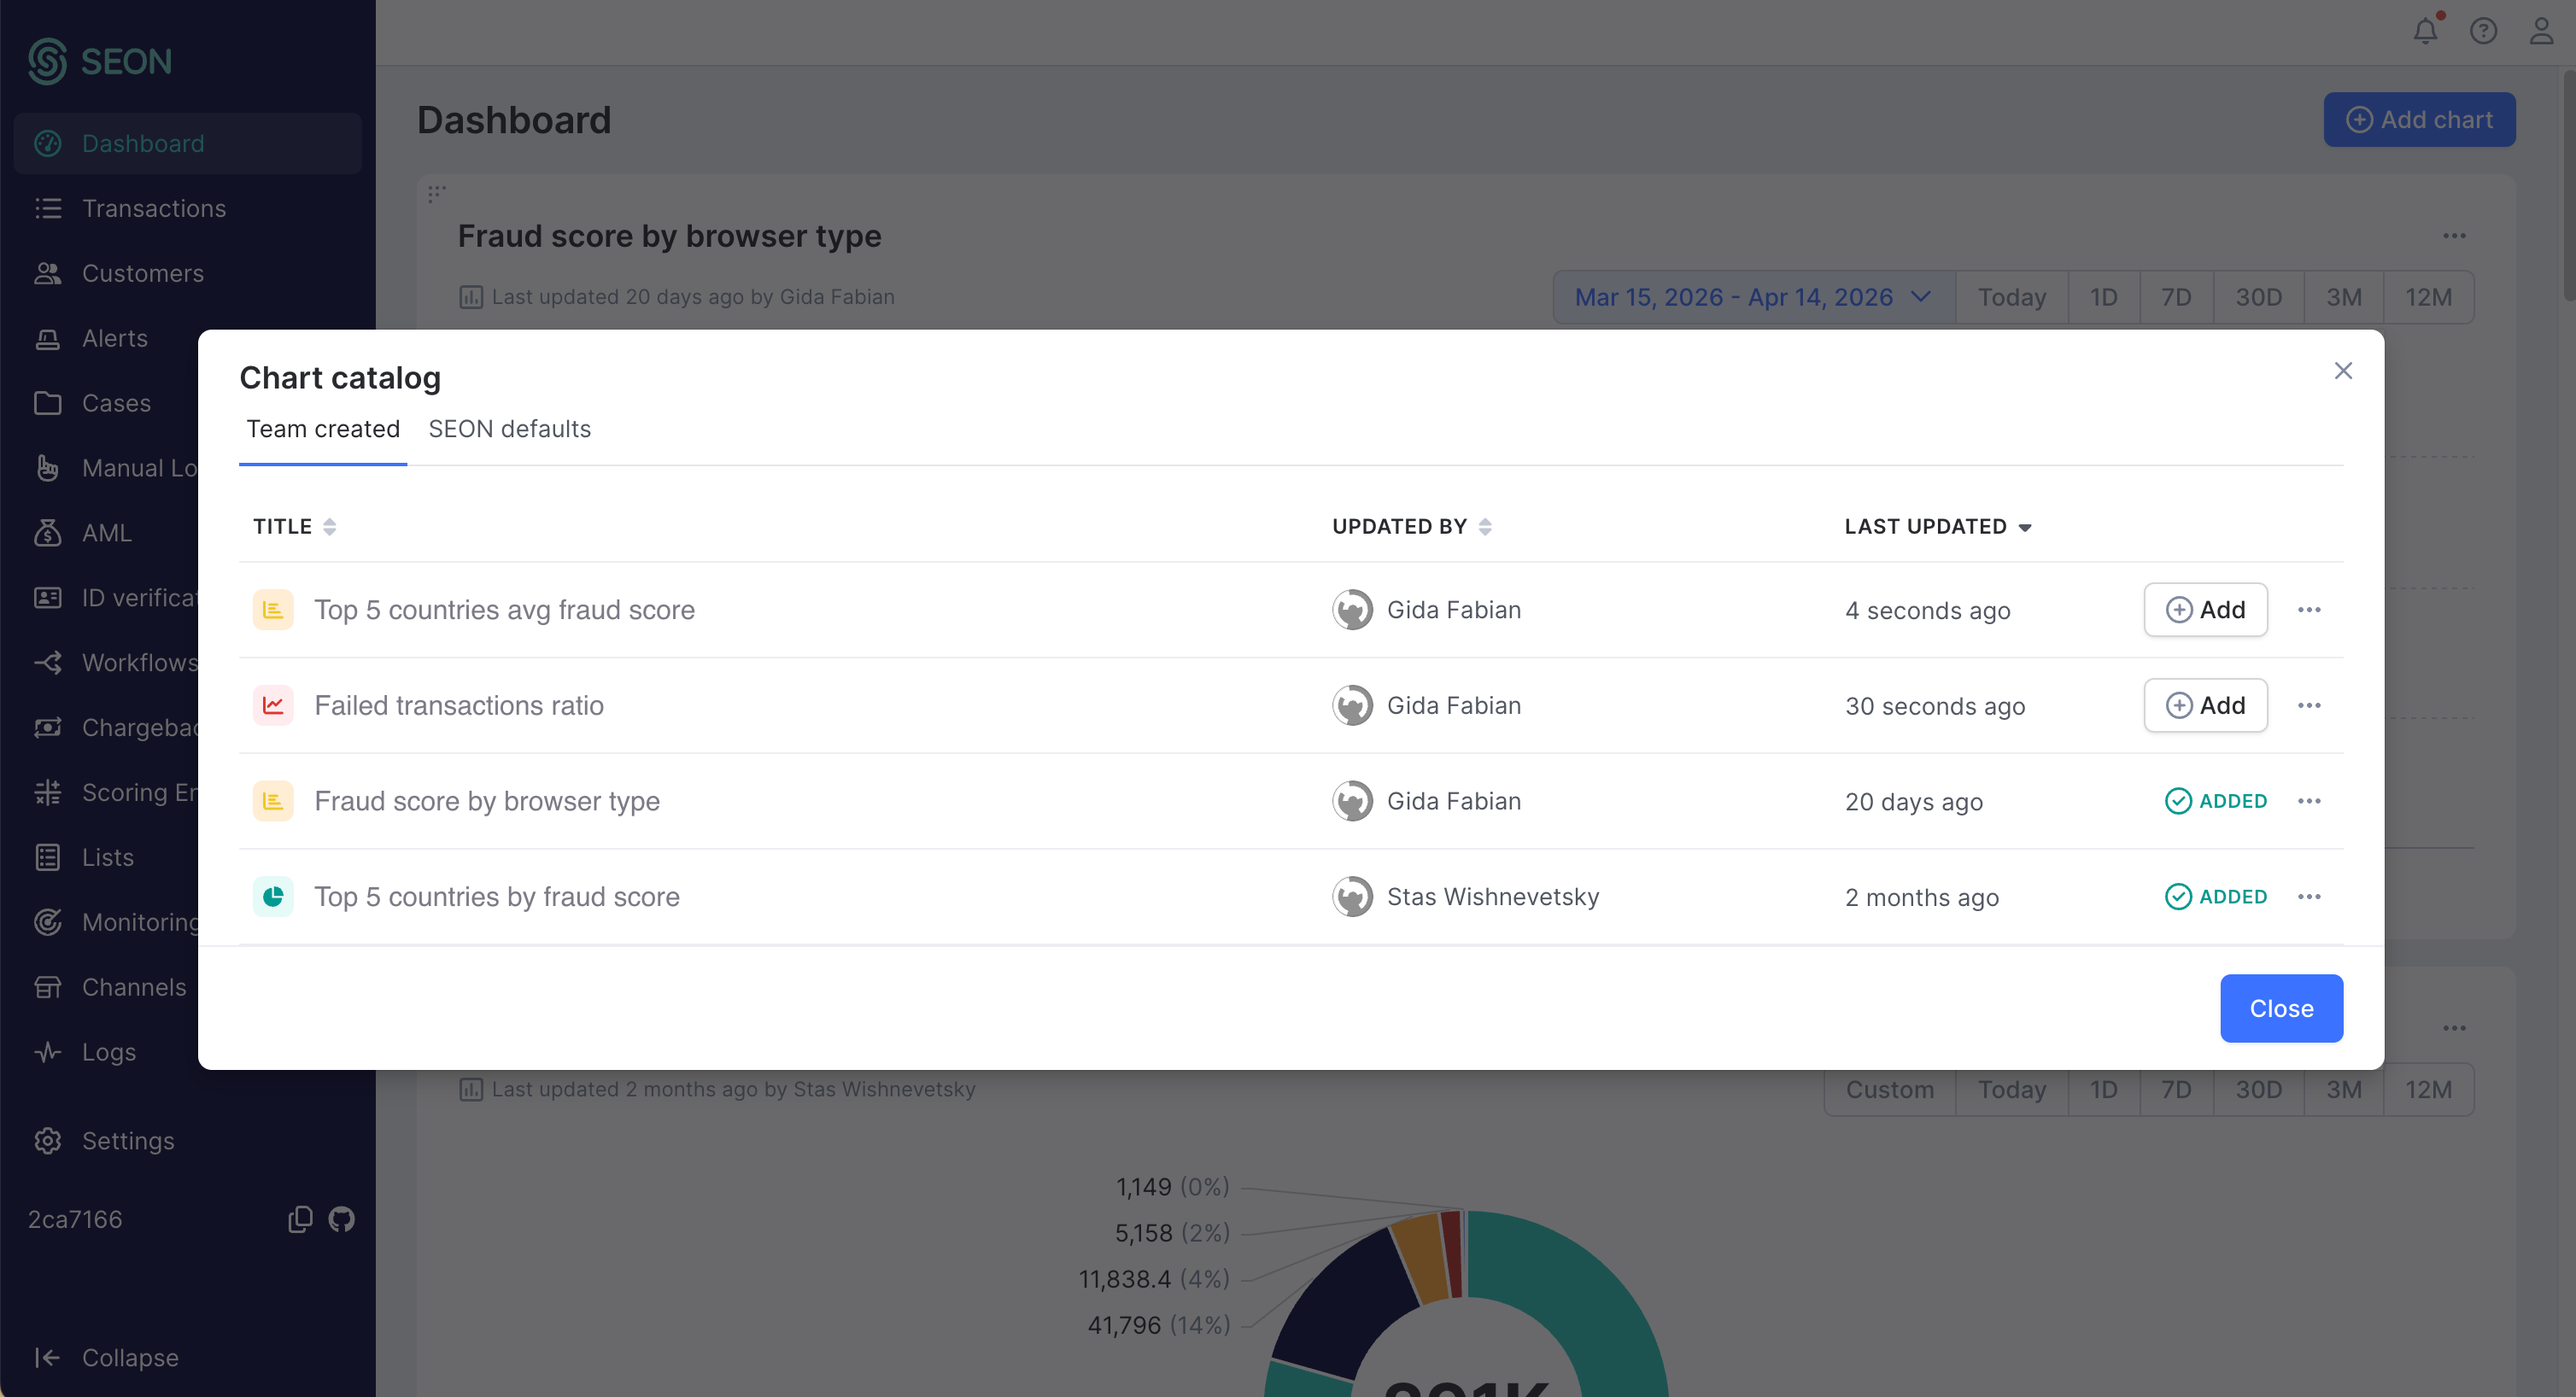
SEON defaults: Pre-built charts that ship with SEON (for example, top transaction locations, transaction labels, applied rules statistics)
From either tab, you or your teammates can add a chart to a dashboard.
Manage saved charts
From the Chart catalog, you can:
- Add a saved chart to your dashboard
- Open chart details
- Edit a chart
- Delete a chart
Example prompts
You can use prompts such as:
- Trend of failed transactions by country
- Fraud score by browser type
- Show repeat transactions per user ID
- Top 5 countries by fraud score
- Declined transactions segmented by decline reason
- Sudden increase in high-value transactions
Tips for better results
- Be specific about the business question you want to answer
- Mention the main dimension you want to group by, such as country, browser, customer or decline reason
- Include the metric you want to measure, such as transaction count or fraud score
- Ask one question at a time instead of combining several asks in a single prompt
- Use the date filter and visualization selector to refine a close result rather than rewriting the prompt from scratch
Limitations
- AI chart builder currently supports only transaction and customer records
- It does not support separate AML, standalone IDV, rules, lists, cases or other module-specific datasets
- A dashboard can contain up to 50 charts and widgets in total
- Your team’s Chart catalog can contain up to 100 saved AI-generated charts
- AI-generated charts cannot be exported, downloaded or shared outside your team
- AI-generated results may not match your intent perfectly on the first try
- Some requests may be rejected if they are unclear, incomplete, unsafe or violate security restrictions
- AI can make mistakes — always review the generated chart for accuracy before using it for decisions
Troubleshooting
The chart is not generated, or the result is not what you expected
- Rewrite the prompt in a clearer, more specific way
- Focus on a single question rather than combining several asks into a single prompt
- Try a simpler grouping or metric
- Confirm that the request is based on transaction or customer records rather than AML, standalone IDV, rules, lists, cases or another separate module
You do not see create a chart with AI
- The feature may not be enabled for your account. Contact your SEON administrator.
- You may not have Chart write permission.
A saved chart is missing from a teammate’s dashboard.
Saved charts are added to the Chart catalog, not to every dashboard automatically. Your teammate can add the chart from the Team-created tab in the catalog.
FAQ
Does saving a chart add it to my dashboard automatically?
No. Saving adds the chart to your team’s shared Chart catalog. You can then add it to a dashboard from the Team-created tab.
Can my team use the charts I create?
Yes. Saved charts are shared with your team through the Chart catalog.
Can I edit a saved chart later?
Yes. If you have Chart write permission, you can open, edit and save changes to existing AI-generated charts.
Can I delete a chart?
Yes. If you delete a shared chart, it is removed from the Chart catalog and from every dashboard where it is currently in use.
Why can I change the date range on a dashboard but not save it as a new default?
Adjusting the date range on a dashboard is a temporary view. The saved chart keeps its original date range so that the same chart stays consistent for everyone on your team. To change the default range, open the chart from the catalog, adjust the date range there and save.
Why don’t I see AML, IDV, rules, lists or case data in my generated chart?
AI chart builder currently supports only transaction and customer records. Data from separate modules such as AML, standalone IDV, rules, lists and cases is not available in AI-generated charts at this time.
Can AI-generated charts be wrong?
Yes. AI can make mistakes, and the generated result may not always match your intent. Always review the chart and its rationale for accuracy before using it for analysis or decisions.
What is the rationale shown with a generated chart?
The rationale is a short, plain-language explanation of how the AI interpreted your prompt — which fields it picked, how it grouped the data, and any filters it applied. Reviewing the rationale is the quickest way to confirm the chart is answering your actual question, and to spot cases where the AI has chosen the wrong underlying field.
Is there a limit on how many AI-generated charts I can save?
Yes. Your team’s shared Chart catalog can contain up to 100 saved AI-generated charts. If you reach the limit, delete charts you no longer need before creating a new one.