


Anomaly detection alerts

Updated on 02.10.26

1 minute to read

Copy link
Overview
System anomaly alerts notify risk and compliance teams when key metrics deviate significantly from their rolling 90-day historical baseline.
Instead of manually tracking transaction decline rates, review rates, fraud scores, and rule trigger frequency, the system does it for you and sends an alert when something unusual happens.
System anomaly alerts are a type of alert trigger available within SEON's Alerts module. You configure them once, and SEON handles the ongoing monitoring. When a metric breaches the threshold, SEON generates an alert in your Alerts dashboard, complete with a time-series chart, key statistics and context on which rules changed during the anomaly period.
Four anomaly types are available:
- Decline rate anomaly: triggered when transaction decline rates change significantly
- Review rate anomaly: fires when your transaction review rate changes significantly
- Fraud score anomaly: triggered when the average fraud score shifts significantly
- Rule trigger frequency anomaly: triggered when a specific rule fires significantly more or less often than its baseline

Before you start
- To view alerts, you need the Alert permission at the View level.
- To create or edit alert triggers, you need the Alert trigger permission at the Edit level.
- Anomaly detection requires a minimum of approximately 100 transactions per hour to produce reliable results. Accounts with lower transaction volumes may not receive alerts or may receive them infrequently.
- Newly created rules have a ~2-day warm-up period before alerts can fire for them. During this period, the system evaluates baseline variance.
- You can create a maximum of 200 alert triggers.
How anomaly detection works
SEON analyzes anomalies in the background on a reccuring basis, evaluating data every 15 minutes and producing anomaly outputs once per hour. Each system anomaly alert trigger compares the current value of a metric against its historical baseline using a statistical confidence interval.
When a metric breaches the upper or lower boundary of the confidence interval, an anomaly is detected and an alert is generated in your Alerts dashboard.
Seasonality is factored into the historical baseline calculation automatically.
System anomaly alert sensitivity determines how wide or narrow the confidence interval is and by extension, how much a metric must deviate before an alert fires:
| Sensitivity | When to use |
| High | Detect small, early shifts; higher alert volume |
| Medium (default) | Balanced signal-to-noise ratio |
| Low | Only flag significant changes; lower alert volume |
You can set sensitivity independently per trigger. A rule you're actively calibrating might warrant High sensitivity; a stable, long-running rule typically only needs Low — so you only get alerted when something genuinely unexpected happens.
How to set up a system anomaly alert trigger
The Alert triggers details page shows the full configuration of a trigger and its edit history.
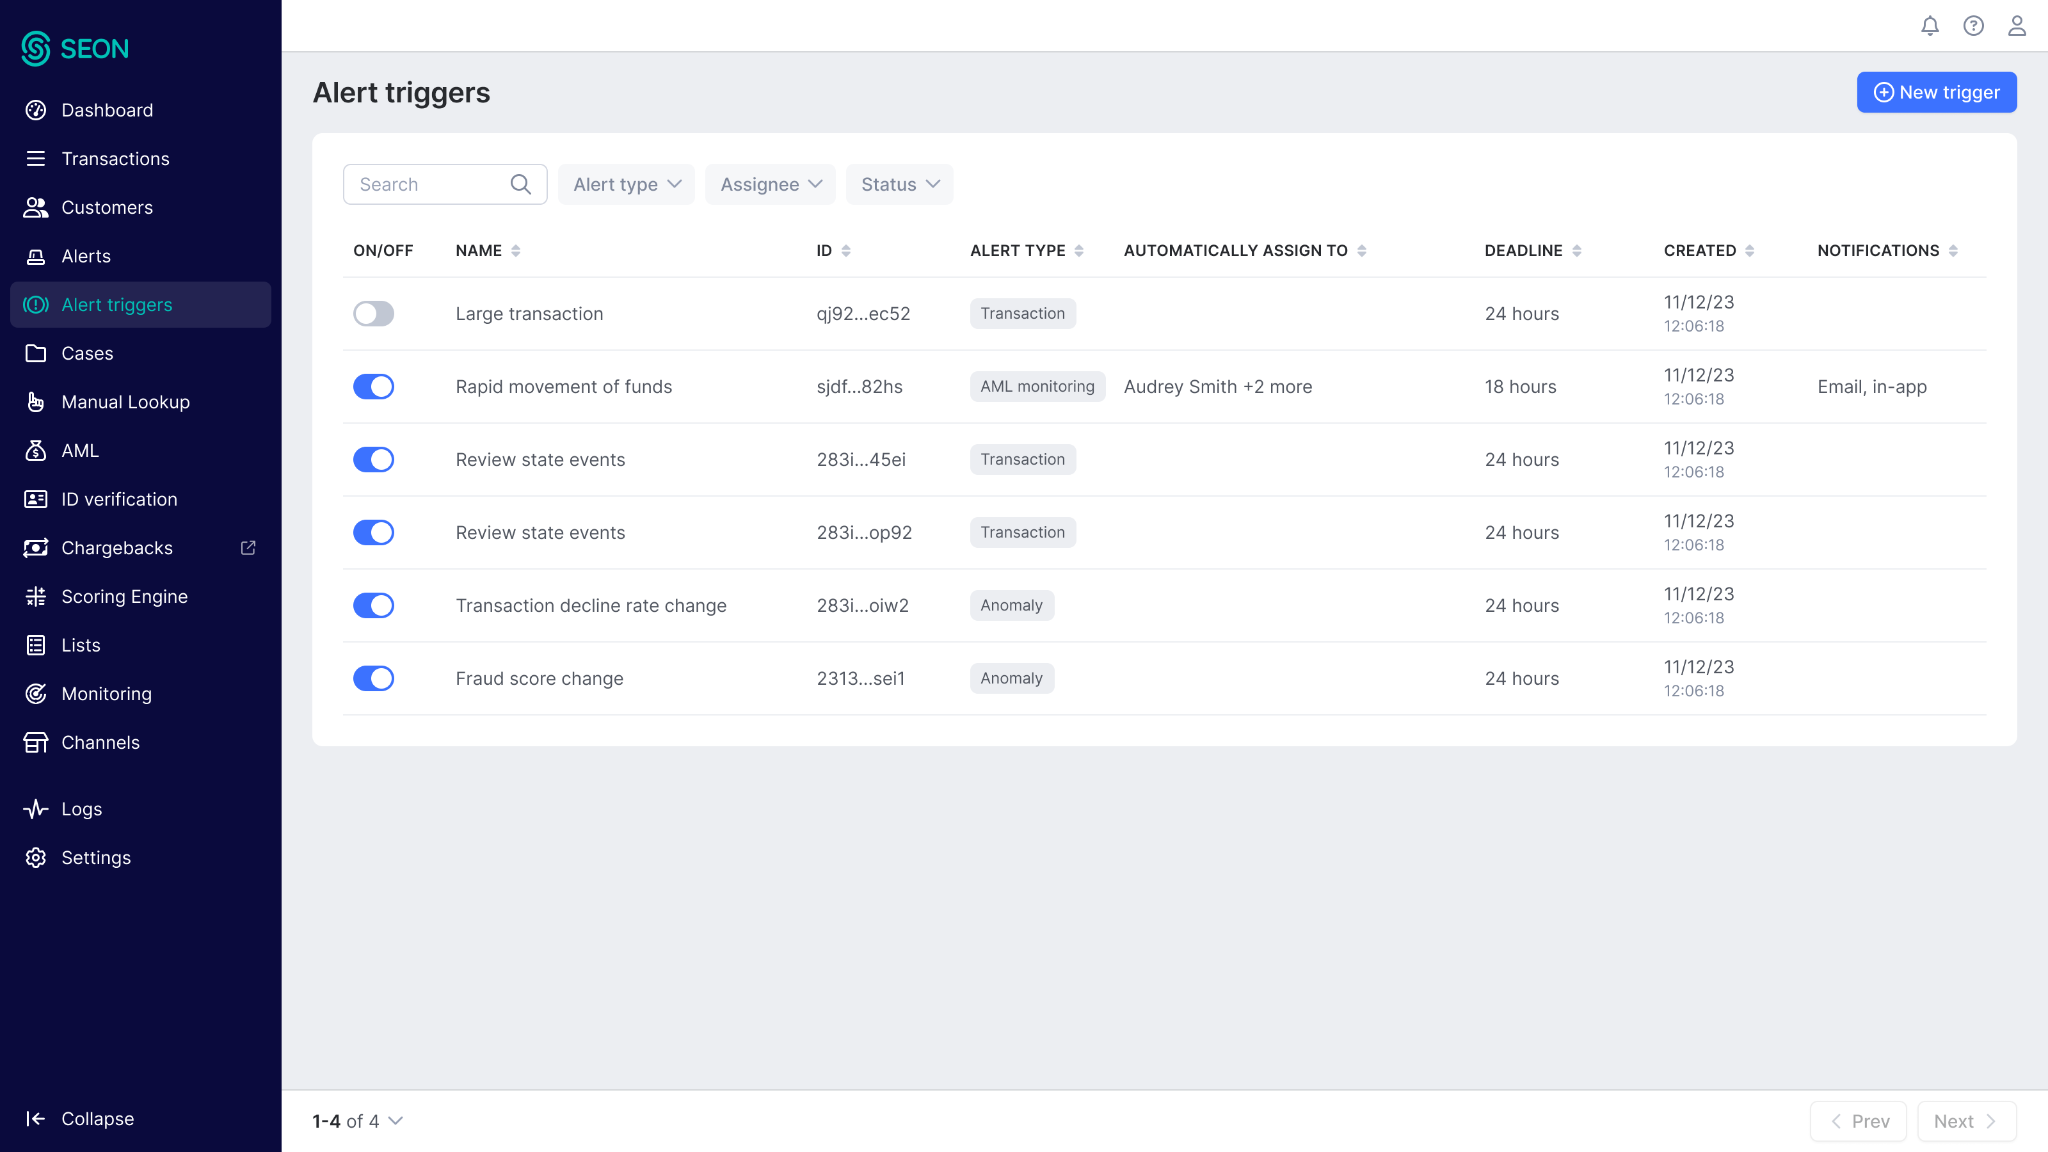
- Go to Alert triggers in the left sidebar.
- Click New trigger in the top right.
- Fill in the Attributes section including the name of the alert trigger, deadline, assignee, notification preferences (in-app and/or email), and a checklist.
- Under the Trigger event, select System anomaly.
- Under Choose anomaly type, select one of the four types including Decline rate anomaly, Review rate anomaly, Fraud score anomaly or Rule trigger frequency anomaly.
- Set the Sensitivity level to High, Medium or Low.
- Add Filters to limit which transactions are included in the anomaly calculation (filters are combined with AND logic and available for decline rate, review rate and fraud score types).
- Click Create trigger.
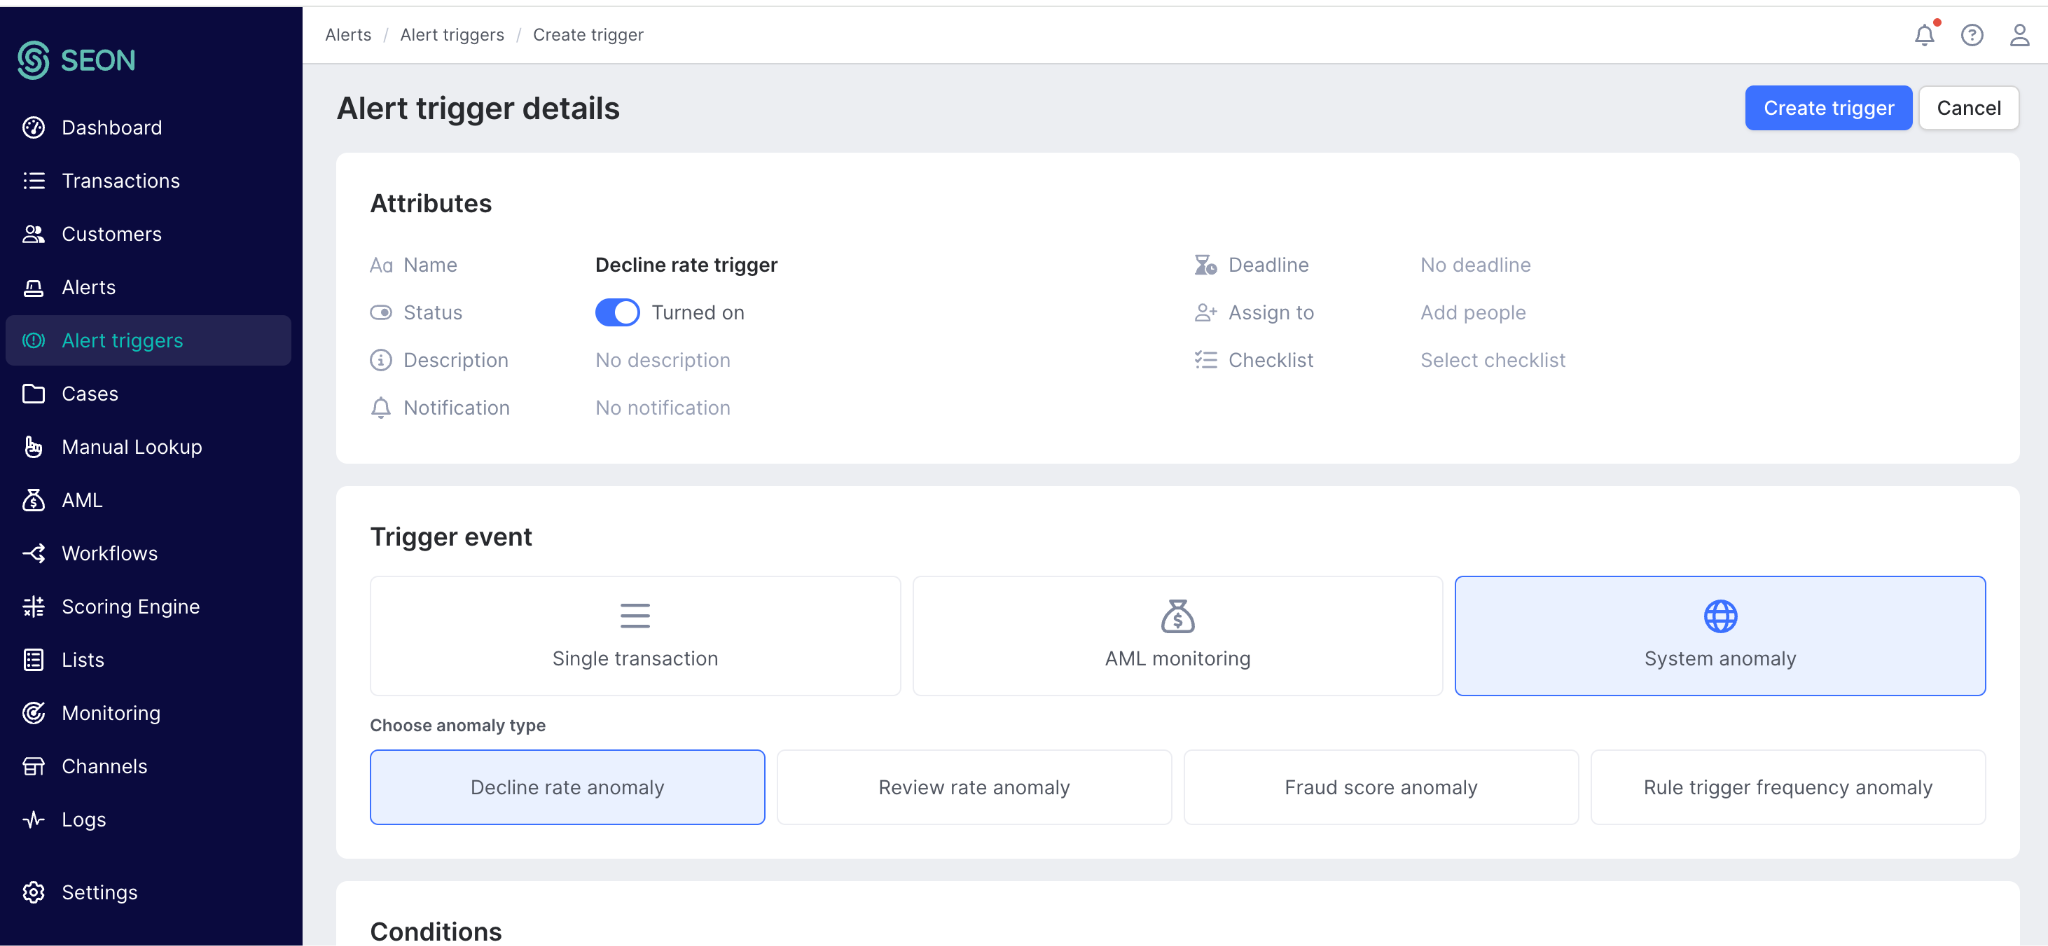
You can also edit an alert trigger by clicking on an alert trigger within the Alert triggers menu.
At the bottom of the alert trigger setting page there’s an audit log of all changes made to the trigger (date, action, editor).
How to review a system anomaly alert
When an anomaly alert fires, clicking it opens the Alert details page. This page has two tabs: Summary and Analyst log.
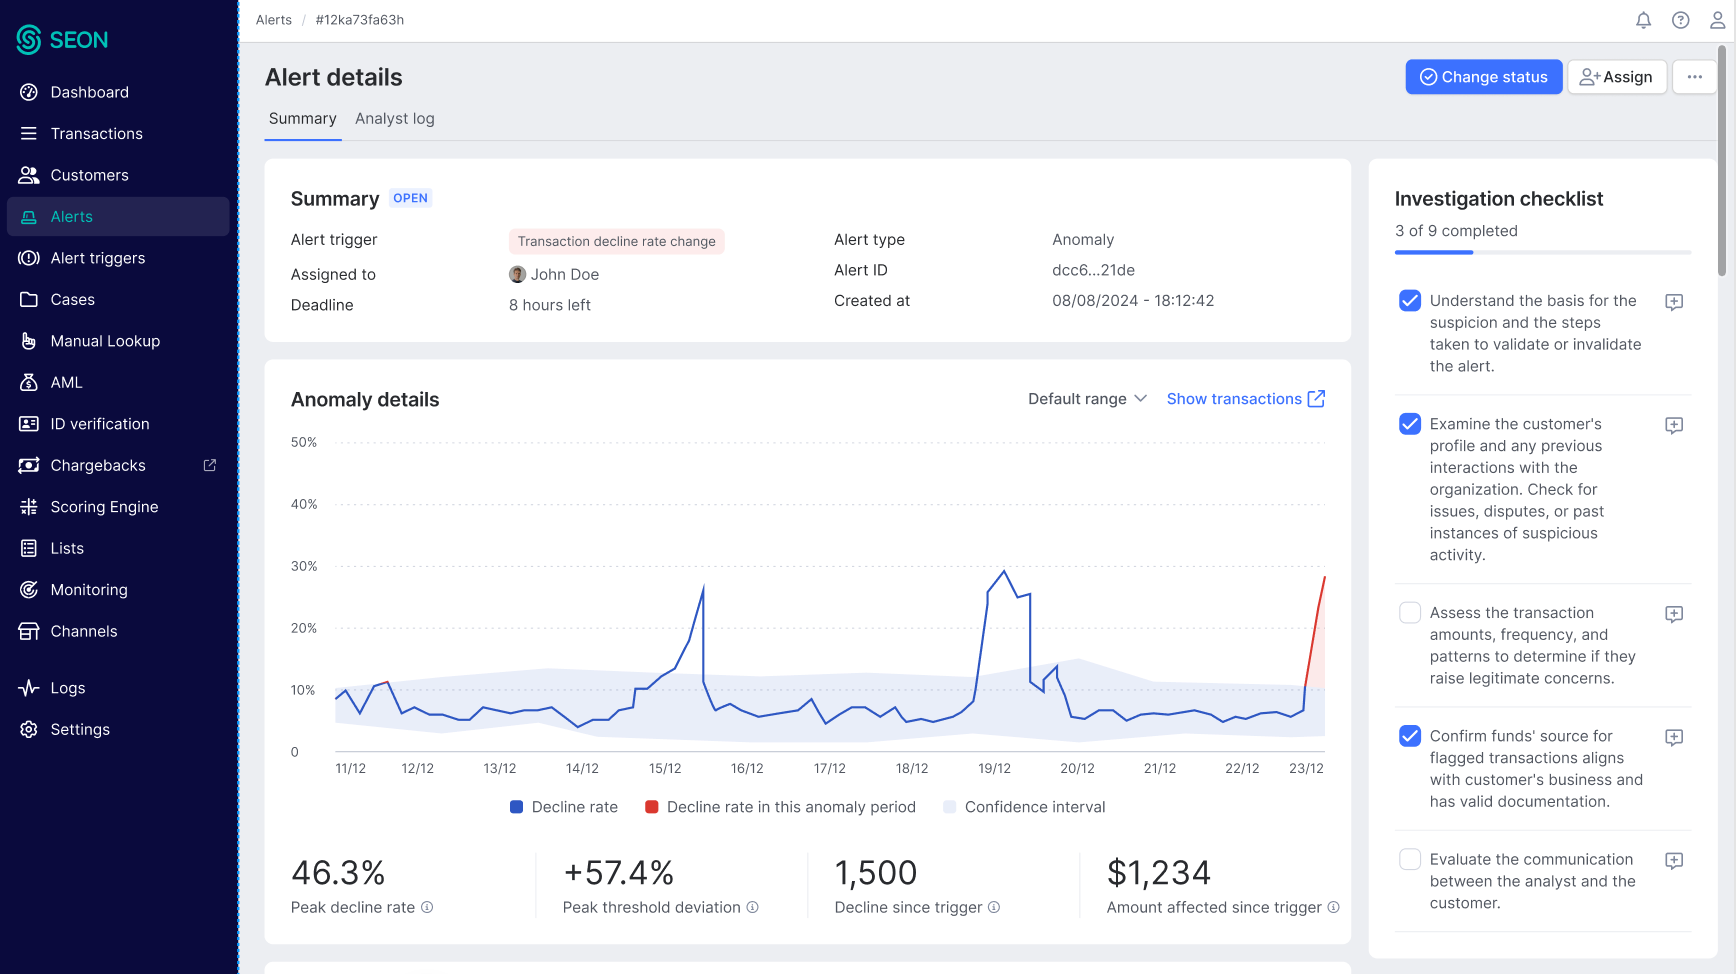
Summary tab
The Summary tab contains three main sections: Anomaly details, Statistics and Rule events.
Anomaly details
The chart shows the metric over time, including the confidence interval band, the historical baseline and the anomaly period (highlighted in red).
- Default view: Shows the state of the metric at the moment the alert was triggered.
- Live view: Updates continuously until the anomaly resolves or up to 14 days. Once the anomaly resolves, the chart freezes at the resolution point.
- Time range selector: Change the displayed date range using the dropdown. This is available on all anomaly chart types and five preset views are available — Maximum history (90 days before and after the alert), More history (30 days), Default range (14 days), Less history (7 days), and Minimal history (2 days) — each showing a symmetric window centered on the moment the alert was triggered.
- Show transactions: Opens a filtered transaction list scoped to the anomaly period.
Statistics
Each anomaly type surfaces a specific set of summary statistics. Statistics are only updated during the active alert period.
Decline rate anomaly and Review rate anomaly
| Stat | Description |
| Peak decline / review rate | Highest rate recorded during the alert period |
| Peak threshold deviation | Largest deviation from the confidence interval threshold during the alert period |
| Decline / reviews since trigger | Number of declined or reviewed transactions since the alert was triggered |
| Amount affected since trigger | Total value of those transactions since the alert was triggered |
Fraud score anomaly
| Stat | Description |
| Peak fraud score | Highest fraud score recorded during the alert period |
| Peak threshold deviation | Largest deviation from the confidence interval threshold |
Rule trigger frequency anomaly
| Stat | Description |
| Peak trigger volume | Highest number of times the rule fired within a single period |
| Peak threshold deviation | Largest deviation from the confidence interval threshold |
Rule events
The Rule events section appears for decline rate, review rate and fraud score anomaly alerts. It contains two tabs:
- Most increased rules since anomaly: The rules with the largest change in trigger frequency during the anomaly period, compared to the equivalent preceding period. Change is normalized to a per-hour rate to allow fair comparison.
- Recent rule updates: Rule configuration changes made within the last two weeks. Changes from further back are not shown to avoid misleading context.
- Notes: A rich-text notes widget is available on every alert for documenting findings, actions taken and next steps.
Alert lifecycle and statuses
System anomaly alerts follow similar status workflow as all other SEON alerts:
| Status | Meaning |
| Open | Newly generated; requires investigation |
| In progress | Analyst has started working on it |
| False positive | Investigated and determined not to be a genuine anomaly |
| Closed | Issue identified; no further action required |
An alert remains open until an analyst closes it manually. There is no automatic cool-down or auto-close. SEON does not close anomaly alerts on your behalf.
Filtering anomaly calculations
Filters let you scope an anomaly alert trigger to a specific subset of transactions, for example, a particular channel, payment method or customer segment.
- Filters are set per trigger on the Alert trigger details page under Conditions —> Filters.
- Multiple filters are combined with AND logic.
- When no filters are applied, the anomaly calculation covers all transactions for your account.

Limitations
- Anomaly detection requires a minimum of ~100 transactions per hour. Accounts below this threshold are unlikely to receive alerts reliably.
- Newly created rules have a 2-day warm-up before alerts can fire.
- If a rule is deleted, no further alerts fire for triggers monitoring that rule. Historical data on existing alerts is still accessible.
- Rule trigger frequency alerts support one rule per trigger. Create a separate trigger for each rule you want to monitor.
- The alert details chart covers a maximum of 14 days for long-running alerts.
- Recent rule updates shown in the Rule events widget cover the last 2 weeks only.
- Monitoring of data fields (e.g. IP, device ID, country, OS) is not available in the current version. This is planned for a future release.
- A maximum of 200 anomaly alerts can be created per account.
- If 50 or more unique field values breach their threshold simultaneously (relevant for future data field alerts), SEON caps alert generation at 1,000 alerts at a time.
FAQ
How is the anomaly baseline calculated?
The baseline is derived from a rolling 90-day historical window using a statistical confidence interval. Seasonality patterns are factored in automatically.
How quickly will I be notified after an anomaly occurs?
The system evaluates data every 15 minutes and produces anomaly outputs once per hour. Expect a maximum delay of approximately one hour between the anomaly occurring and the alert appearing in your dashboard.
Why am I not receiving alerts even though I have a trigger configured?
The most common reasons are: (1) your transaction volume is below ~100 transactions per hour, (2) a newly created rule is still in its ~2-day warm-up period, or (3) the trigger is toggled off. Check the Alert trigger details page to verify the trigger status and filter configuration.
What happens when I change the sensitivity setting?
The confidence interval is recalculated using the new sensitivity setting. Existing open alerts are not retroactively affected — only new anomaly detections use the updated threshold.
Can I have multiple anomaly alert triggers for the same metric?
Yes. For example, you can create two decline rate triggers with different filter sets — one for credit card transactions and one for bank transfers — each with its own sensitivity setting.
What happens if a rule I'm monitoring gets deleted?
The rule is inactivated, and its historical data remains accessible on existing alert detail pages. No new alerts will fire for a deleted rule or trigger and the trigger will be deleted as well.
Does closing an alert allow the anomaly to be detected again?
Yes. Closing an alert resets the detection for that trigger. If the metric breaches the threshold again, a new alert will be generated.
Can I edit a saved alert trigger?
Yes. Go to Alerts —> Alert triggers, click the trigger you want to update, make your changes, and click Save trigger. All edits are recorded in the Alert trigger history at the bottom of the page.
Can I add any type of rule to a rule trigger frequency alert — including custom and default rules?
Yes. Both custom rules and default (system) rules can be added to a rule trigger frequency alert trigger.
Can I run anomaly alerts at the same time as regular transaction alerts?
Yes. Anomaly alerts and transaction-level alerts are independent trigger types. You can run both simultaneously. Transaction alerts fire on individual transactions; anomaly alerts fire on aggregate metric shifts.