


Velocity Aggregate Signals

Updated on 09.11.26

13 minutes to read

Copy link
Overview
Velocity Aggregate Signals adds the history of each user, card, device and other entity to fraud investigation and to AI Insights Score.
Each aggregate measures one behavior over a time range, such as how many devices a user has used in the last 30 days. When an aggregate reaches a warning threshold, it shows as a risk signal on the transaction details page.
In the Admin Panel, you can filter the transaction list by these time-based patterns. For example, you can list every transaction where the user had used more than 5 devices in the 30 days before it. On the transaction details page, risk signals make the patterns that matter for a decision stand out.
AI Insights Score uses the same aggregates. A single transaction shows only what it contains, while velocity aggregates show what happened to its user, card, and device before it. This lets the score detect changes in behavior over time, which helps catch account takeover, multi-accounting, and account reselling.
How it works
Each aggregate counts or averages one value for one entity over one time range. For example, Cards per user (1d) counts the distinct cards a user has used in the last 24 hours. Every time range is a rolling window that ends at the transaction, so 1 day means the last 24 hours, not the calendar day.
The current transaction is not included in its own values. If Cards per user (1d) shows 3, the user had used 3 distinct cards in the 24 hours before this transaction. A new card used in this transaction counts from the user's next transaction.
Values are calculated when a transaction is processed and are stored with it, so the value on a past transaction does not change.
Transactions processed before Velocity Aggregate Signals was enabled have no stored aggregate values. Their data still counts toward the aggregates of later transactions.
Lifetime aggregates cover all the data SEON holds for your account. They go back to your earliest data in SEON, or to your data retention limit if that is more recent.
SEON provides 123 aggregates across 8 categories in the Admin Panel, plus 7 that are available in the Fraud API response only. Default settings apply as soon as Velocity Aggregate Signals is enabled, so filters, values, and risk signals in the Admin Panel work without any setup. SEON calculates the aggregates for every transaction, whatever your settings. To also receive the values in the Fraud API response, add velocity_signals to the response_fields setting of your request, next to the fields you already list.
Data the aggregates use
Aggregates are calculated only from the data that is available for the given transaction. If a type of data is missing, the aggregates that depend on it have no value.
This applies at two levels:
- Your integration: if you do not use SEON device intelligence, device aggregates have no value for any transaction.
- A single transaction: if a transaction has no card details, its card aggregates, such as
Users per card, have no value. Aggregates about the user, such asCards per user, still show the count from earlier transactions.
A value of 0 is different from no value: the data was there, but nothing was seen in the time range. For example, Users per bank account (7d) shows 0 for a bank account that no other user has used before.
To get the most complete aggregates, send user, email, card, device, address, phone, and bank account data with every transaction where it applies.
Fraud patterns that show over time
A single transaction can look clean while the history behind it shows a pattern. Velocity Aggregate Signals helps uncover these types of fraud in particular:
Bonus abuse: one person redeems many promotions, often from shared devices and payment methods. Check Campaigns per user (30d).
Multi-accounting: one person runs several accounts, so the same phone, device, or card appears under different users. Check Users per phone (1d).
First-party fraud: one person sets up new accounts to repeat chargebacks, cycling cards and bank accounts from the same device. Check Bank accounts per device (1d).
Lifetime aggregates look back further than velocity rules, which cover up to 30 days. For example, Campaigns per user (lifetime) also shows bonus abusers who stay under a monthly limit.
Investigate fraud patterns with aggregates
Velocity Aggregate Signals supports investigation from two starting points. You can start from a single transaction and widen the search, or start from a pattern and narrow it down to the transactions behind it.
Start from a risk signal
While you review a transaction, a risk signal shows which behavior stands out, for example Many cards (1d) on the Identity widget. This points to a pattern that matters for your decision. To check how widespread it is, filter on the matching aggregate, here Cards per user (1d), and review the other transactions that share the pattern.
Start from a filter
Filter the transaction list for a suspicious time-based pattern, such as 3 or more cards per user in the previous 24 hours. The result is a set of suspicious transactions that you can investigate one by one. Save the filter with Save for later to review the same pattern regularly.
Filter transactions by an aggregate
Every aggregate that is turned on in the settings is available as a filter field on the transaction list. Aggregate fields are grouped by category under the Aggregates heading, and each one shows its calculation type below the name.
To filter by an aggregate:
- Go to Transactions, then select Filter.
- Under Build manually, open Select data field and select an aggregate under Aggregates.
- Select a comparison and enter a value.
- Run filter.
For example, Cards per user (1d) of 3 or more lists transactions where the user had 3 or more cards in the previous 24 hours. Aggregate filters combine with other filter fields, and you can save them with Save for later.
If you use velocity rules with a zero score only to find matching transactions, an aggregate filter gives you the same list without a rule.
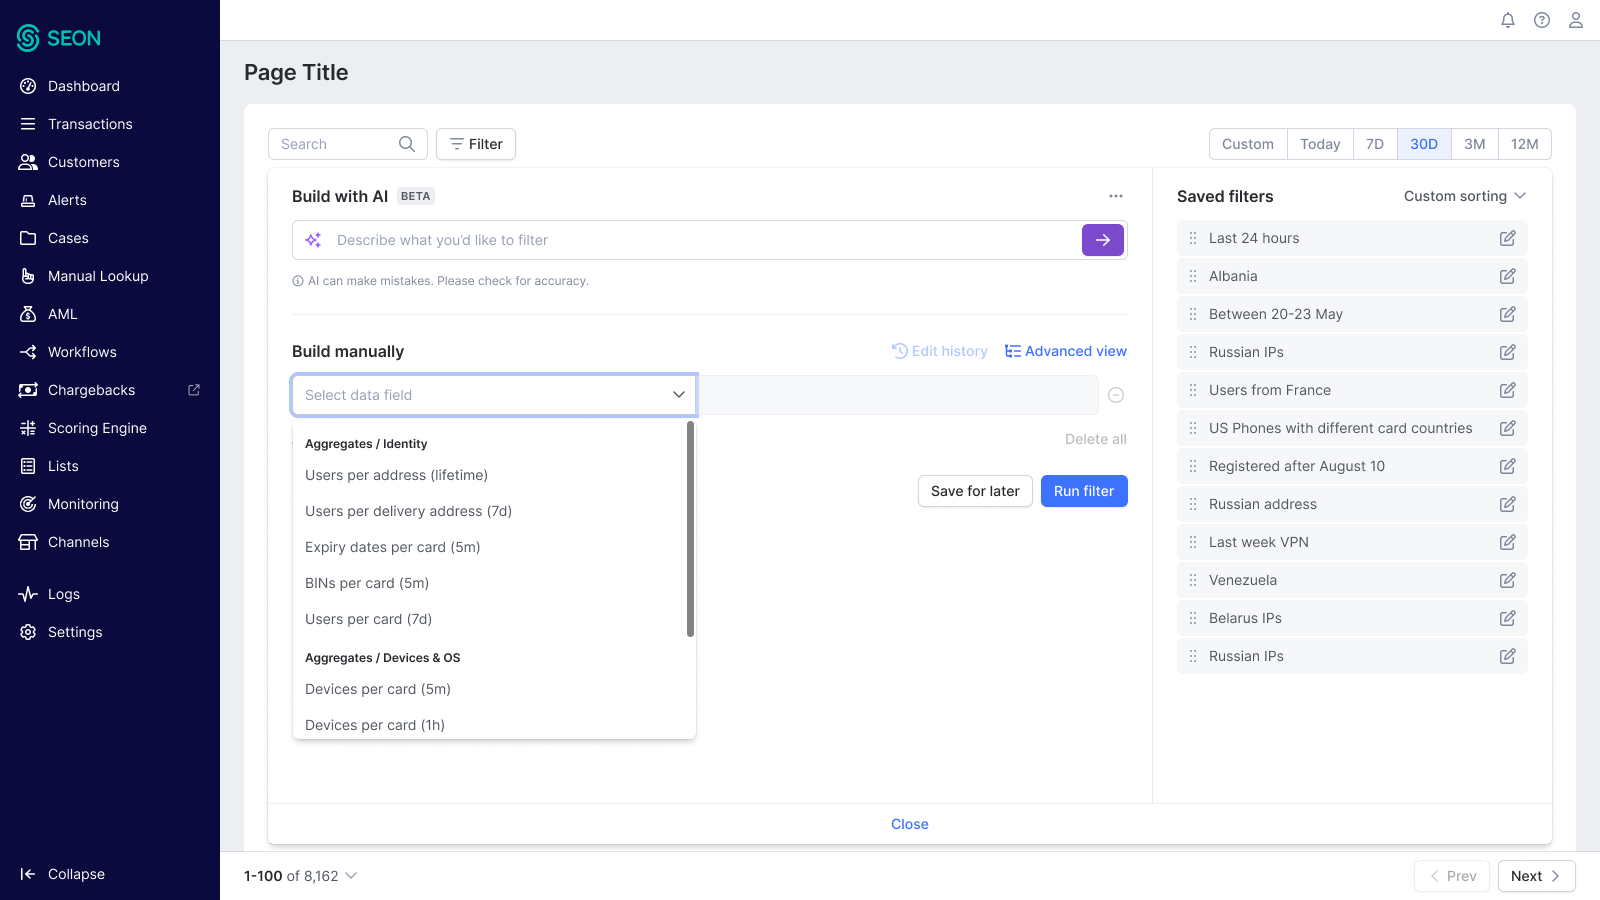
Aggregate values on transaction details
Each transaction details widget shows an Aggregates section that lists the name and value of every aggregate in its category that is turned on. Aggregates in the Other category appear in the Additional details widget. Different time ranges of the same measurement appear as separate rows.
Aggregates without a warning threshold still show their value. If none of a widget's aggregates are turned on, the widget has no Aggregates section.
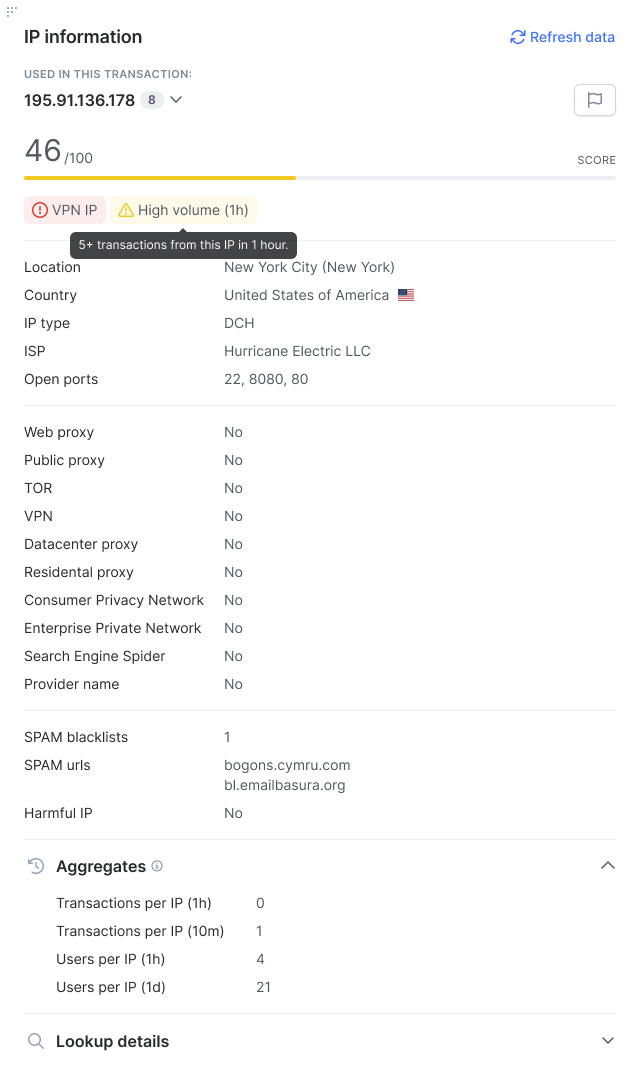
Risk signals
Velocity Aggregate Signals adds its own risk signals to the transaction details widgets. Risk signals are color-coded tags that highlight fraud risk at a glance. Velocity risk signals are always yellow, which marks medium risk.
A velocity risk signal appears when an aggregate value reaches its warning threshold. It shows at the top of the widget, next to the widget's other risk signals. Its name includes the time range, for example High volume (1h).
Risk signals are advisory. They do not change the fraud score or the transaction state, and aggregates are not available in Scoring Engine rules.
Hover over a risk signal to see what it measures and the threshold that triggered it. If several time ranges of the same measurement reach their thresholds, each one raises its own risk signal.
Risk signals on past transactions
Risk signals are evaluated against your current settings each time a transaction is opened, while aggregate values stay as they were recorded. If you raise a threshold, a past transaction can stop showing a risk signal it showed before. If you turn an aggregate off, its value and risk signal no longer appear on past transactions either.
Every change to aggregate settings is recorded in the activity log, so you can see when the settings changed.
Manage aggregates in settings
Go to Settings, then select Aggregates under Capabilities. The table lists every aggregate available in the Admin Panel with its status, name, time range, category, and warning threshold. Hover over the information icon next to a name to see what the aggregate measures.
To find an aggregate, search by name or filter by status, category, or time range. You can sort by any column.
Changing settings requires the System settings permission. Changes apply to your whole account and take effect only after you select Save settings. Each save is recorded in the activity log.
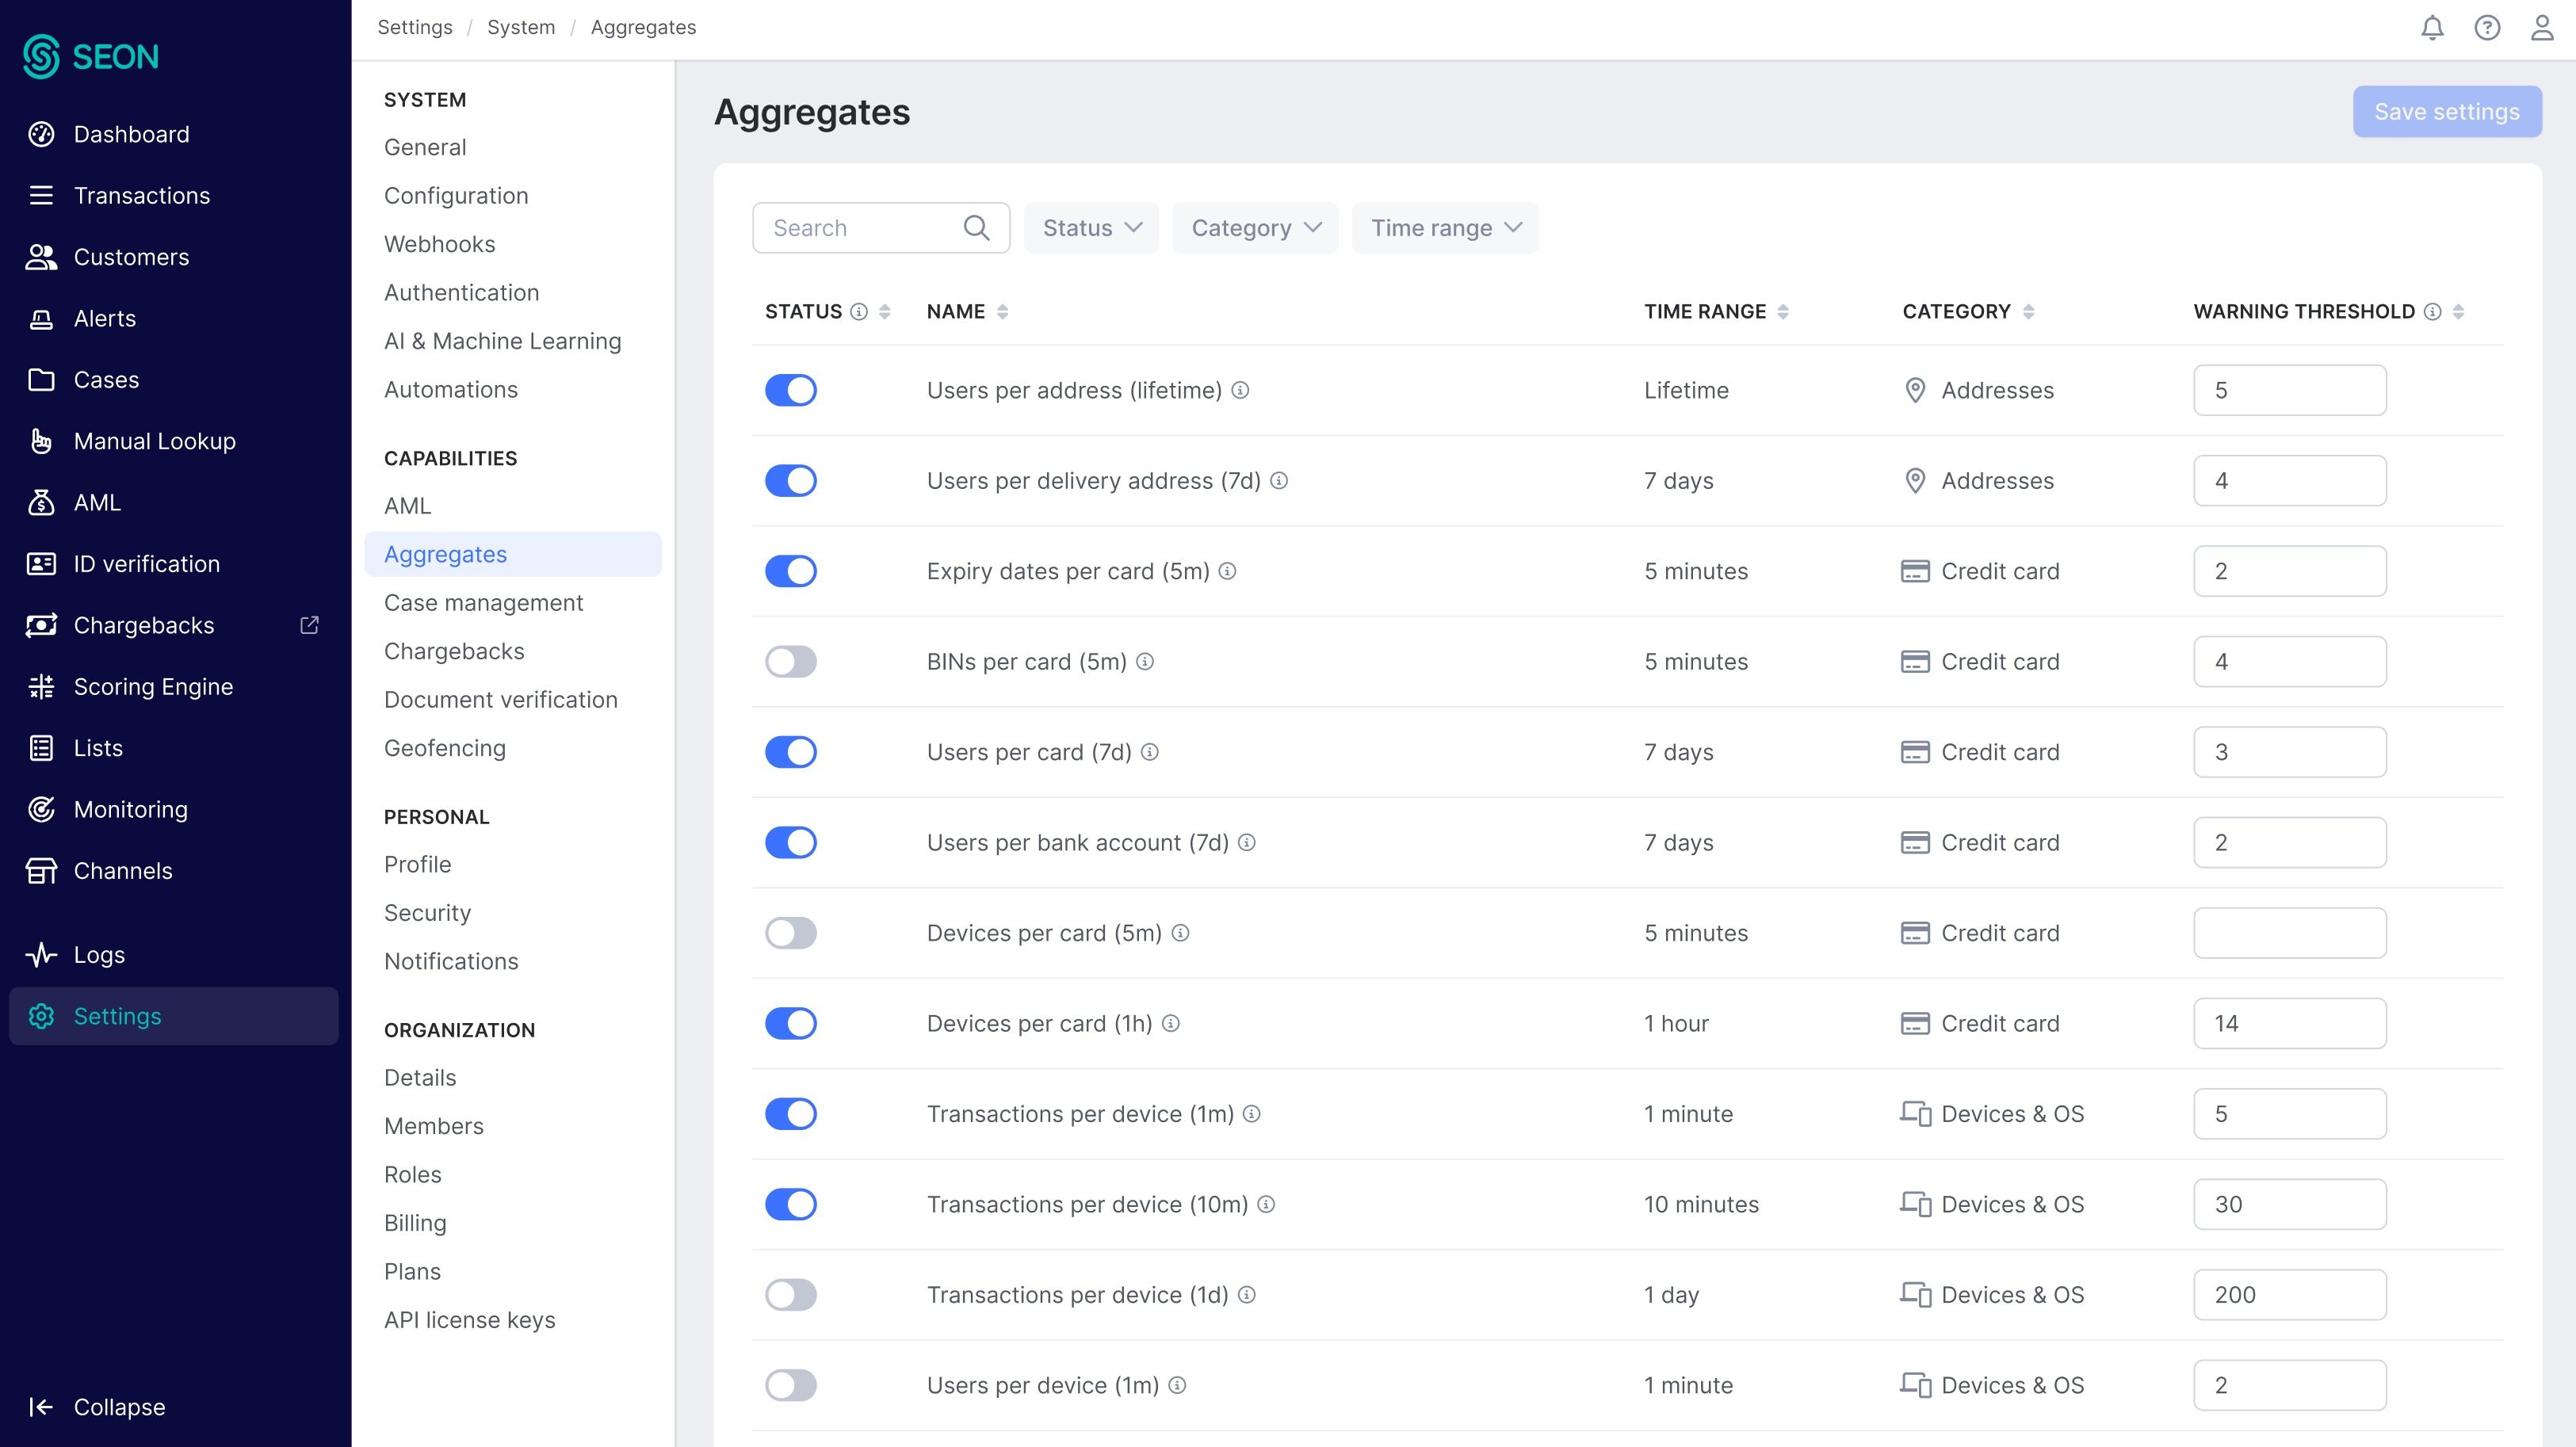

Turn an aggregate on or off
The settings toggle controls whether an aggregate appears as a transaction filter field and on the transaction details page. An aggregate that is turned off still appears in the Fraud API response and is still used in AI Insights Score training. Turning it off only hides it: SEON still calculates and stores its value for every transaction.
To turn an aggregate on or off:
- Go to Settings, then select Aggregates under Capabilities.
- Turn on or turn off the toggle in the Status column.
- Select Save settings.
Aggregates that have a default warning threshold are on by default. The others are off by default because no single threshold fits every business. You decide whether to turn them on and which threshold to set.
Set a warning threshold
The warning threshold is the value at which an aggregate raises a risk signal on the transaction details page. The risk signal appears when the value is equal to or greater than the threshold.
To set a warning threshold:
- Go to Settings, then select Aggregates under Capabilities.
- Enter a number in the Warning threshold column of the aggregate.
- Select Save settings.
The right threshold depends on your business patterns. Consider how often a pattern occurs in your traffic and what counts as high for you. For example, if your users transact often, a transaction count that is unusual elsewhere can be normal for you.
Start from the default where one exists, and adjust it if the risk signal fires too often or too rarely.
To stop an aggregate from raising risk signals, clear its threshold and save. The value still appears on the transaction details page while the aggregate is turned on.
AI Insights Score
AI Insights Score uses every aggregate, including API-only aggregates, once Velocity Aggregate Signals is enabled for your account. From this point on, the model learns from how each entity behaved before the current transaction, not only from the transaction itself. Your aggregate settings and your Fraud API requests do not affect this.
Model performance improves as data accumulates, so the effect builds gradually and can take time, depending on your traffic and model training settings. Timely, accurate transaction labels help the model learn. For details, see AI insights score and explanation and Labeling best practices.
Aggregates in the Fraud API
You can also receive aggregate values in the Fraud API response and use them in your own analytics, data pipelines, or model training. The response includes every Admin Panel aggregate, whatever your settings, plus the API-only aggregates. Aggregates the transaction has no data for are left out of the response.
API-only aggregates are more specific and are intended mainly for machine learning models, so they do not appear in the Admin Panel. AI Insights Score uses them as well.
For the request configuration, the response format, and the full list of fields, see the Velocity Aggregate Signals section of the Fraud API reference.
Terms used in aggregate names
An aggregate has the same name in transaction details, in the filter list, and on the settings page. Time ranges appear in brackets after the name: m for minutes, h for hours, and d for days. Some aggregate names explain themselves, such as Users per device (5m). Others use terms that need a short explanation:
| Term in name | What is counted | Field |
|---|---|---|
| Payees | Receiving bank accounts | Receiver bank account (receiver_bank_account) |
| Bank accounts | The user's own bank accounts | User bank account (user_bank_account) |
| BINs | Bank identification numbers (BINs) of cards | Card BIN (card_bin) |
| Expiry dates | Card expiration dates | Card expiration date (card_expire) |
| Card countries | Countries where the cards were issued | Card country (bin_country_code) |
| Devices | Devices identified by device intelligence | True Device ID (true_device_id) |
| Device IPs | IP addresses detected by device intelligence | Device IP (device_ip_address) |
| Device IP countries, Device IP ISPs | Countries and ISPs of the device IP address | Device IP country (device_ip_country), Device IP ISP name (device_ip_isp) |
| Countries | IP countries | IP country (ip_country) |
| Cities | IP cities | IP city (ip_city) |
| ISPs | Internet service providers (ISPs) of the IP address | ISP name (ip_isp_name) |
| DNS IP countries, DNS ISPs | Countries and ISPs of the DNS server the device uses | DNS IP country (dns_ip_country), DNS ISP name (dns_ip_isp) |
| Carriers | Mobile network carriers reported by the device | Carrier name (carrier_name) |
| Phone carriers | Carriers of the phone numbers | Phone carrier (phone_carrier) |
| Delivery address | Shipping address | Shipping address hash (shipping_address_hash) |
| Surnames | User last names | User last name (user_lastname) |
| Birth dates | User dates of birth | User date of birth (user_dob) |
| Campaigns | Bonus campaigns | Bonus campaign ID (bonus_campaign_id) |
FAQ
How do Velocity Aggregate Signals differ from regular aggregates?
Regular aggregates are an option in velocity rules. You set them up in the Scoring Engine, and they calculate an aggregate of aggregates over recurring intervals, such as the average of a user's daily averages over a month. As part of a rule, they affect the fraud score. Velocity Aggregate Signals aggregates need no setup: SEON calculates them on every transaction and shows them as values, filters, and risk signals, without changing the fraud score. To set up regular aggregates, see How to use regular aggregates.
Why is an aggregate missing from the filter list?
There are two possible reasons. The aggregate may be turned off, because it has no default threshold that fits every business. Turn it on in the aggregate settings and save.
The aggregate may also be API-only. API-only aggregates are intended mainly for machine learning models and are not available as filter fields.
Why does an aggregate show a value but no risk signal?
The aggregate either has no warning threshold or its value is below the threshold. Set a threshold in the aggregate settings to raise a risk signal.
Why did a risk signal disappear from a past transaction?
Risk signals follow your current settings. If the warning threshold was raised or the aggregate was turned off after the transaction, the risk signal no longer appears. Check the activity log to see when the settings changed.
Why does a past transaction have no aggregate values?
The transaction was processed before Velocity Aggregate Signals was enabled for your account. Aggregate values are calculated and stored only for transactions processed after enablement. An aggregate can also have no value if the transaction did not include the data it depends on, such as card details.
Can I stop SEON from calculating aggregates for my account?
Turning aggregates off in the settings hides them in the Admin Panel. SEON still calculates them, returns them in the Fraud API response when you request them, and uses them in AI Insights Score. To stop the calculation for your account entirely, contact your account manager.
Aggregates in the Admin Panel
The lists below show the 123 aggregates available in the Admin Panel, grouped by category. Each category matches the transaction details widget where its aggregates appear, except for Other, whose aggregates appear in the Additional details widget. Time ranges are listed in brackets after each name. To see the default status and warning threshold of each aggregate, go to Settings, then select Aggregates under Capabilities. For field names and API-only aggregates, see the Fraud API reference.